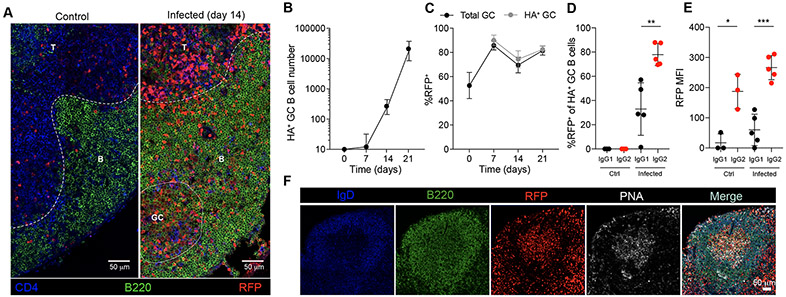
Figure 2. T-bet expression in GC B cells during influenza infection.
Tbx21-Cre mice were intranasally infected with 50 TCID50 influenza (PR8). Mediastinal lymph nodes were collected on indicated time points and analyzed by flow cytometry and confocal microscopy. (A) Representative confocal micrograph of day 14 infected or control mediastinal lymph node. Scale bars, 50 μm. T: T zone; B: B follicle; GC: germinal center. (B) Numbers of HA+ GC B cells (HA+B220+GL7+Fas+). (C) Percent RFP+ of GC B cells (B220+GL7+Fas+) and HA+ GC B cells (B220+GL7+Fas+HA+). (D) Percent RFP+ of IgG1+ GC B cells and IgG2c+ GC B cells on PBS (Ctrl) and day 21 after infection (Infected). (E) Mean fluorescence intensity (MFI) of RFP in IgG1+ GC B cells IgG2c+ GC B cells on PBS (Ctrl) and day 21 of infection (Infected). (F) Representative confocal micrograph of germinal center on day 14 of influenza infected mediastinal lymph node. Scale bars, 50 μm. (B and C) The data are shown as mean ± s.e.m. (D and E) Each point represents an individual mouse with mean ± s.e.m. All data are representative of ≥ 2 experiments, n ≥ 3 mice per group. Two-tailed t-test (***P < 0.001, **P < 0.01, and **P < 0.05).

