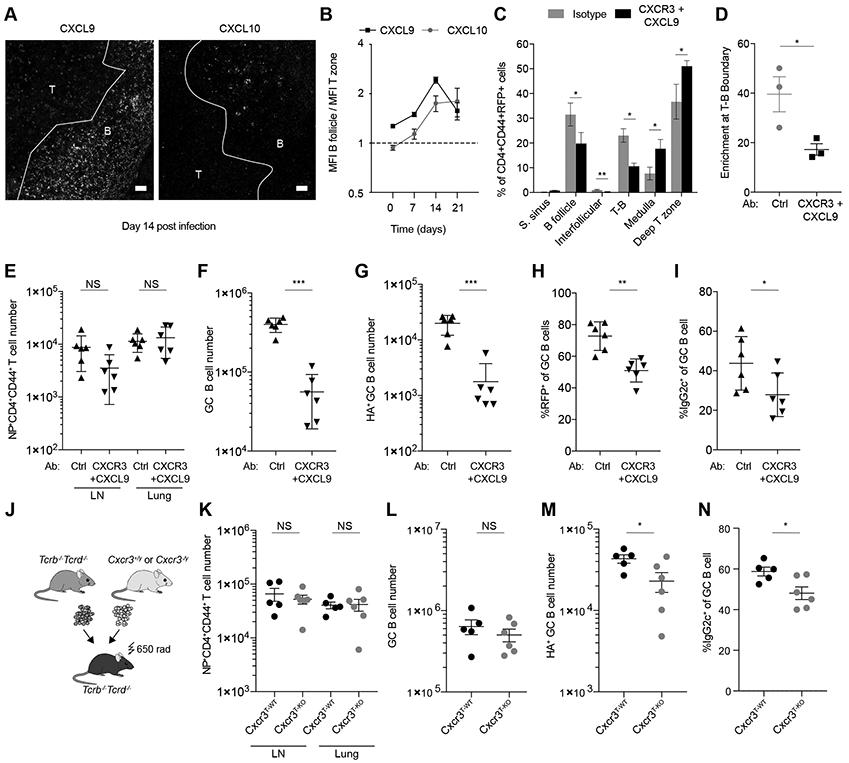
Figure 4. CXCR3 signaling is required for T-bet+ CD4+ T cell enrichment at the T-B boundary.

(A and B) Tbx21-Cre mice were intranasally infected with 50 TCID50 influenza (PR8). CXCL9 and CXCL10 were analyzed by immunofluorescence and confocal microscopy in mediastinal lymph nodes. (A) Representative confocal micrographs on day 14 after infection. Scale bars, 20 μm. T: T zone; B: B follicle. (B) Mean fluorescence intensity of CXCL9 and CXCL10 was quantified in T-zone and B follicles. Plot shows ratio of mean fluorescence intensity in B follicle over mean fluoresce intensity in T-zone at indicated time points after infection. (C to I) Tbx21-Cre mice were intranasally infected with 50 TCID50 influenza (PR8) and treated with CXCR3 and CXCL9 blocking antibodies or isotype controls. Mediastinal lymph nodes were collected at day 14 and analyzed by confocal microscopy and flow cytometry. (C) Quantification of percent of CD4+CD44+RFP+ T cells in indicated lymph node areas. (D) Percent of CD4+CD44+RFP+ cells of T-zone found in T-B boundary (T-B boundary / (deep T-zone + T-B boundary) x 100). (E) Numbers of NP+CD4+CD44+ T cells in mediastinal lymph nodes and lung. (F) Numbers of GC B cells (B220+GL7+Fas+). (G) Numbers of HA+ GC B cells (HA+B220+GL7+Fas+). (H) Percent RFP+ of GC B cells (B220+GL7+Fas+). (i) Percent IgG2c+ of GC B cells (B220+GL7+Fas+). (J to N) Lethally irradiated Tcrb−/−Tcrd−/− mice were reconstituted with bone marrow cells from Tcrb−/−Tcrd−/− mice and either Cxcr3+/y or CxCr3−/y mice mixed at a 4:1 ratio. After reconstitution mice were infected with 50 TCID50 influenza (PR8) and analyzed 14 days post-infection. (J) Schematic of bone marrow chimera generation. (K) Numbers of NP tetramer+CD4+CD44+ T cells in mediastinal lymph nodes and lung. (L) Numbers of GC B cells (B220+GL7+Fas+). (M) Numbers of HA+ GC B cells (B220+GL7+Fas+HA+). (N) Percent IgG2c+ of GC B cells (B220+GL7+Fas+). (E to N) Intravascular labeling was performed by injecting fluorophore-conjugated CD45 antibody i.v., labeled cells were gated out in this analysis. (B and C) The data are shown as mean ± s.e.m. (D to N) Each point represents an individual mouse with mean ± s.e.m. All data are representative of ≥ 2 experiments, n ≥ 3 mice per group. Two-tailed t-test (***P < 0.001, **P < 0.01, *P< 0.05, and NS = not significant).
