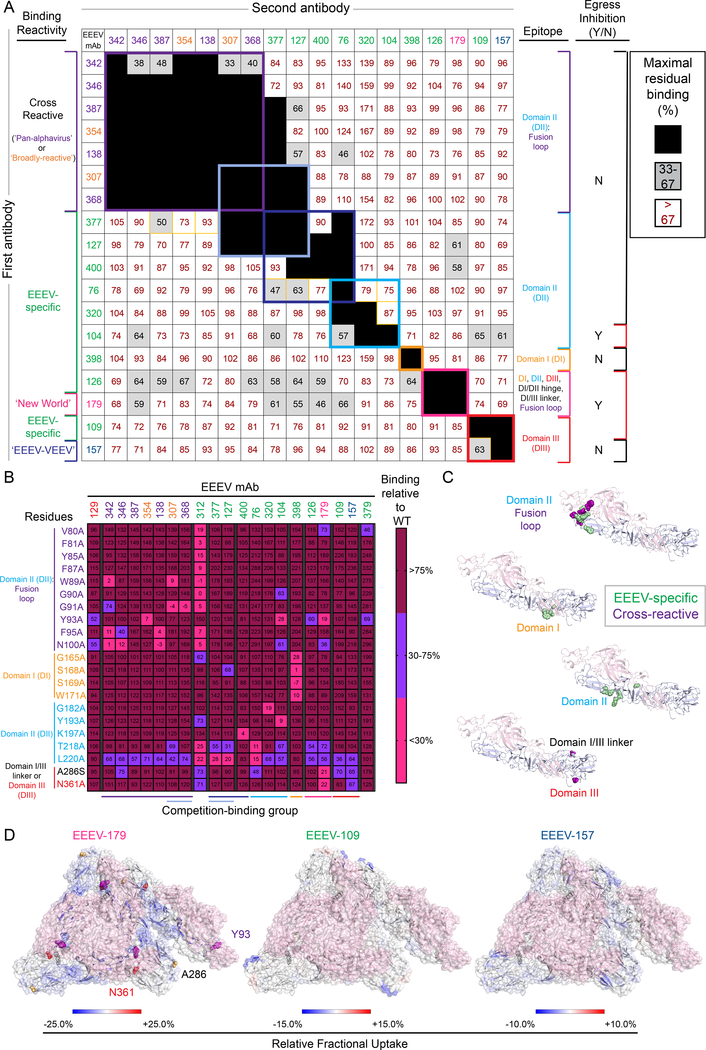
Figure 3. Human E1-specific mAbs recognize cryptic and exposed epitopes on the EEEV E1 glycoprotein.
A. Competition-binding groups as determined by ELISA using EEEV VLPs. Results for a total of 18 mAbs are shown. EEEV-312 and −379 are not shown due to minimal binding to EEEV VLP under the conditions tested. The first mAb (10 μg/mL) incubated with EEEV VLPs is shown in the left-hand column and the second mAb (biotinylated; 0.5 μg/mL) is shown in the top row. Black boxes indicate competition (reduction in maximal binding to <33%), grey boxes indicate intermediate competition (33 to 67% maximal residual binding), and white boxes indicate no competition (>67% maximal residual binding). Competition-binding groups are indicated by the respective colored boxes. Yellow boxes indicate unidirectional competition. Each mAb is colored according to binding reactivity (EEEV-specific [green], cross-reactive: ‘pan-alphavirus’ [purple], ‘broadly-reactive’ [orange], ‘New World’ [magenta], and ‘EEEV-VEEV’ [blue]). Data are representative values of 3 independent experiments. Epitopes identified for each mAb (as described in B through D) are indicated in the right-hand column. Y = inhibition of SINV/EEEV egress and N = no observed inhibition of SINV/EEEV egress (as described in Figure 5). B. Heatmap of mAb binding to critical interaction residues identified through alanine-scanning mutagenesis library analysis of the EEEV E1 glycoprotein. The average percent binding for each mAb is indicated for the residues identified (<30% binding of mAb relative to wild-type (WT), in which the positive control mAb, rEEEV-129 IgG (Williamson et al., 2020), or at least five mAbs exhibited >75% binding to control for expression. The heatmap indicates >75% (maroon), 30 to 75% (light blue), or <30% (magenta) mAb binding relative to WT. Residues are colored based on E1 domain or region (purple [DII, fusion loop]), cyan [DII], orange [DI], red [DIII], and black [DI/DIII linker]). Each mAb is ordered to correspond with the competition-binding groups (A) as defined by the colored boxes and respective lines at the bottom of the heat map. Data represent mean of at least 2 independent experiments. C. Epitope mapping of critical interaction residues identified by alanine-scanning (B) for mAb binding to the EEEV E1 glycoprotein. Critical interaction residues were mapped onto the cryo-EM reconstruction of SINV/EEEV (PDB: 6MX4). A side view of the EEEV E2-E1 heterodimer (E2 – light pink, E1 – light blue) is shown with critical interaction residues indicated by spheres for the EEEV-specific (green) or cross-reactive (purple) E1-specific mAbs. D. Hydrogen-deuterium exchange mass spectrometry for EEEV-179, −109, and −157 Fab molecules binding to the EEEV E1 glycoprotein. Relative fractional deuterium uptake difference at the 10,000 s time point is mapped onto the cryo-EM reconstruction of EEEV VLP (PDB: 6XO4; E2 – light pink). E1 regions are colored from blue to red based on the relative fractional deuterium uptake difference (%). The color scale corresponds to the highest observed difference and is adjusted to −25% to 25%, −15% to 15%, or −10% to 10% for EEEV-179, −109, or −157 Fab molecules, respectively. Regions with no deuterium uptake difference or with no peptide measurements are shown in white. See Figure S2 for analysis of W89A, F95A, and N100A CHIKV E2/E1 and full panel of EEEV E1 alanine mutants tested. See Figure S3 for HDX-MS analysis summary for binding of EEEV-109, −126, −157, and −179 Fab molecules to the EEEV E1 glycoprotein. See Figure S4 and Table S2 for summary of epitope mapping results.

