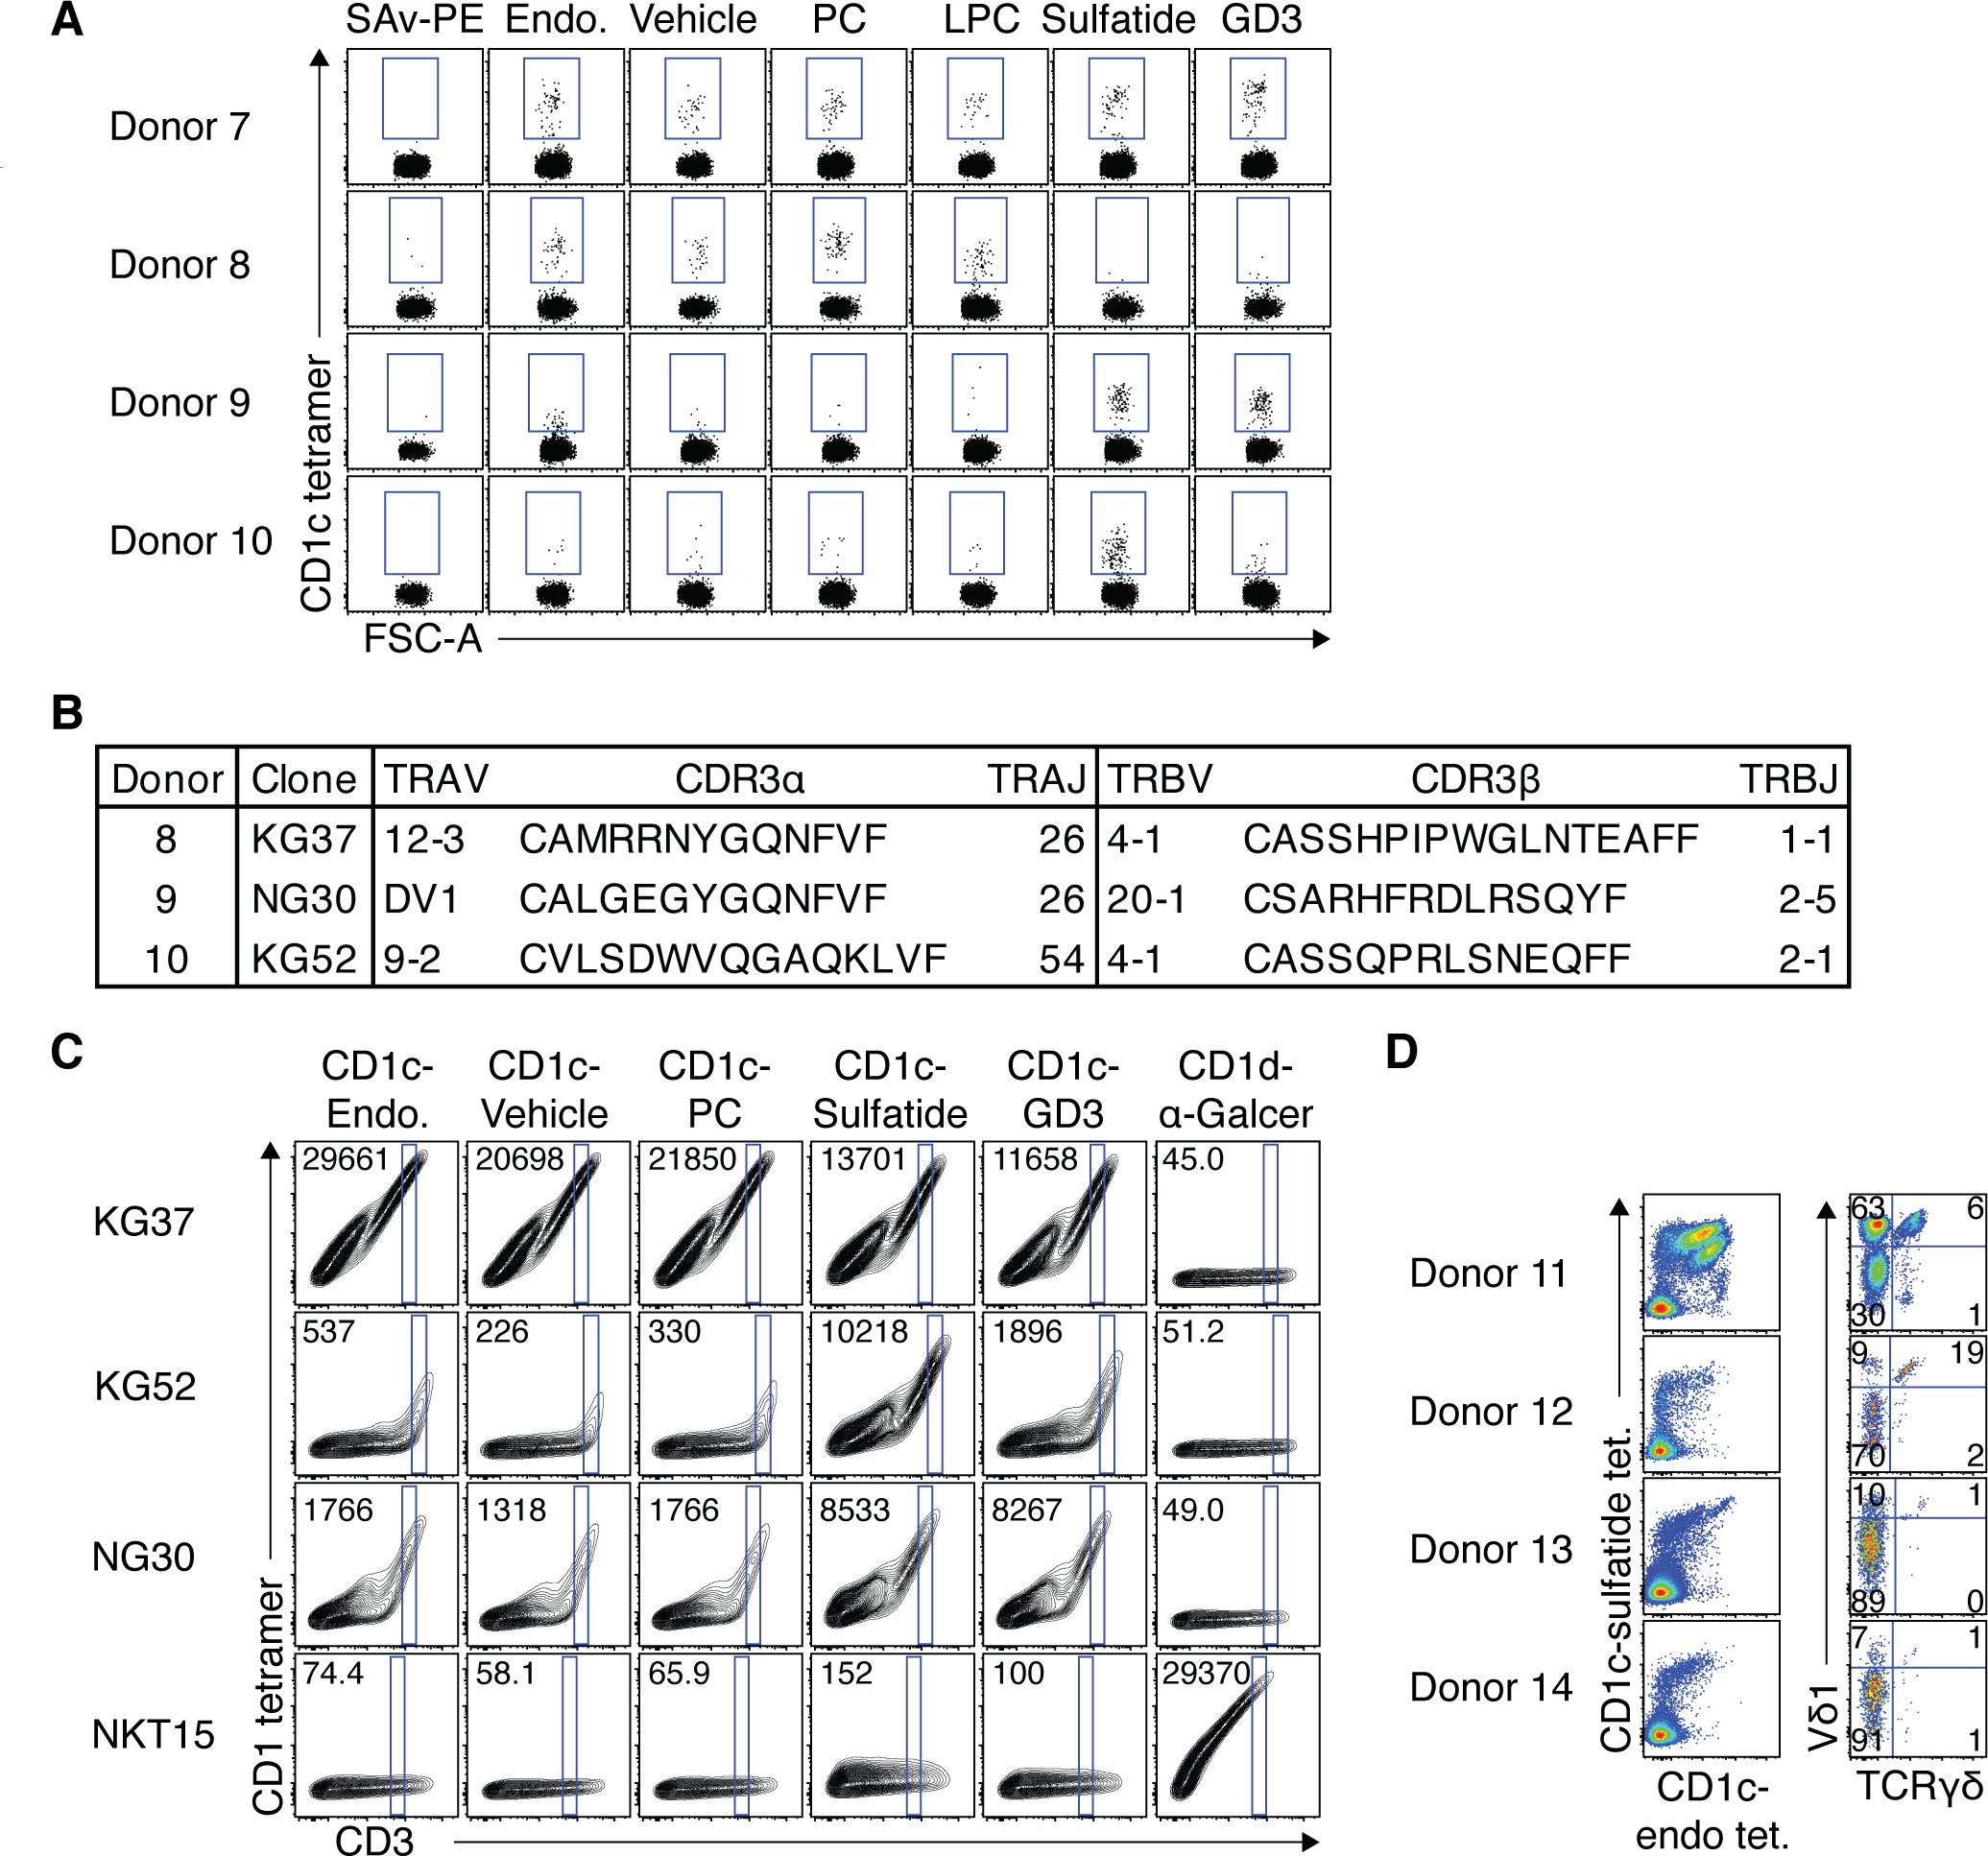
Figure 5: Lipid-antigen discrimination by CD1c-restricted T cells.

A. Dot plots showing staining of CD3+ T cells from 4 donors with CD1c tetramers loaded with PC, LPC, sulfatide or GD3 compared to CD1c-endo or tyloxapol vehicle control. Streptavidin-PE (SAv-PE) was also used a negative staining control. B. Table showing TCR sequences derived from CD1c tetramer+ populations in figure A. C. Representative contour plots showing CD1-lipid tetramer staining of 293T.SCARB1−/− cells transiently transfected to express CD1c-restricted TCRs from table in B or control NKT TCR clone NKT15. Consistent gates were set on a ‘window’ of CD3 expression across the different tetramer for each transfection, and median fluorescent intensity (MFI) of events in that gate is depicted in the top left of each plot. Experiment was performed 5 times for KG37, KG52 and NKT15 and 3 times for NG30, with similar results in each experiment. D. FACS plots from 4 donor PBMC samples co-stained and magnetically enriched with both CD1c-sulfatide and CD1c-endo tetramers. Left panel shows CD1c tetramer co-staining on enriched CD3+ T cells. Right panel shows TCRγδ and Vδ1 staining on total CD1c tetramer+ T cells.
