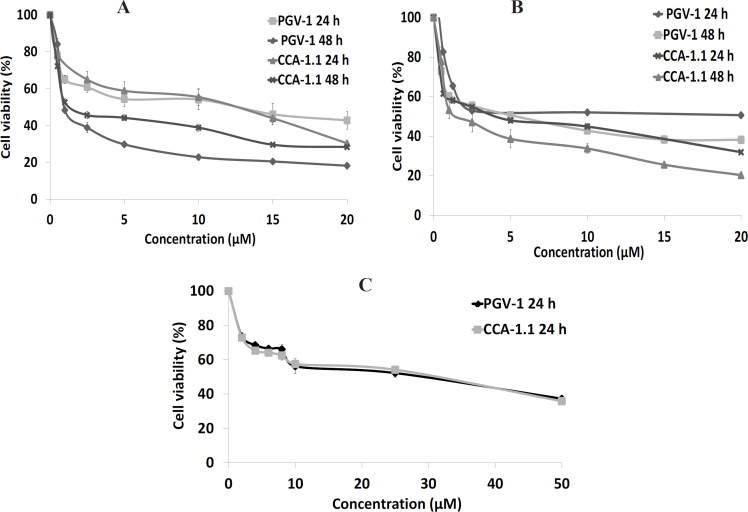
Figure 2.
Cytotoxic Effects of CCA-1.1 and PGV-1 on 4T1 Cells (A), MCF-7/HER2 Cells (B), and 3T3 Cells (C). Cells were seeded in a well-plate and incubated for 24 h before treatment with either CCA-1.1 or PGV-1. The cell viability was evaluated using MTT assay. The figure shows the graph plotted between concentration and cell viability of CCA-1.1 and PGV-1 in 4T1 cells, MCF-7/HER2 cells, and 3T3 cells. The data is presented as the mean ± SE from 3 replications

