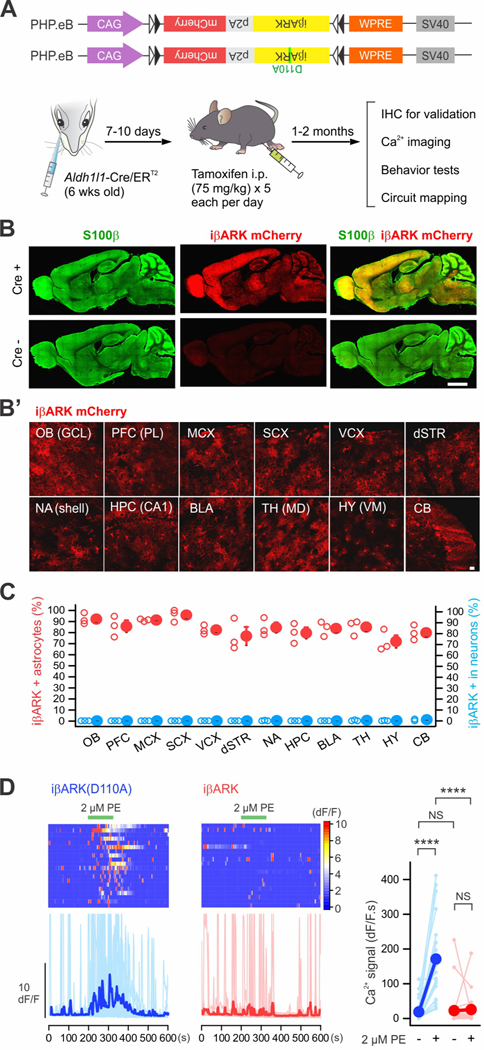
Figure 7. Astrocyte selective iβARK expression in whole brain.
(A) Cartoon illustrating the genome constructs packaged by AAV-PHP.eB capsids and an intersectional genetic approach for expressing iβARK or iβARK(D110A) in astrocytes in whole brain by administrating Cre-dependent AAV-PHP.eB viruses into Aldh1l1-Cre/ERT2 mice. (B) Representative images showing that whole brain expression of iβARK was observed in Aldh1l1-Cre/ERT2-positive mice, but not in Cre negative mice. AAV-PHP.eB-mediated iβARK delivery resulted in expression within S100β positive astrocytes. Subpanel B’ shows iβARK mCherry expression in the granule cell layer (GCL) of olfactory bulb (OB), the prelimbic (PL) subregion of prefrontal cortex (PFC), the layers II/III of the motor cortex (MCX), the sensory cortex (SCX), the visual cortex (VCX), the dorsal striatum (dSTR), the nucleus accumbens shell (NA shell), the hippocampal region CA1 (HPC CA1), the basolateral amygdala (BLA), the mediodorsal thalamus (TH MD), the ventromedial hypothalamus (HY VM) and the cerebellum (CB). (C) The red scatters show that 72 – 96% of astrocytes were iβARK mCherry positive in the indicated 12 brain regions. The blue scatters show that those regions had few iβARK mCherry positive neurons (0 – 1%). n = 3 mice. (D) Kymographs and dF/F traces of Ca2+ responses in dSTR astrocytes with AAV-PHP.eB-mediated iβARK(D110A) or iβARK expression. PE (2 μM) evoked Gq pathway-mediated Ca2+ signaling was significantly attenuated by iβARK. Tetrodotoxin (TTX) at 300 nM was applied in bath throughout the experiments. The graph shows summary plots for the Ca2+ responses. Nested one-way ANOVA was used. Scale bars, 2 mm in B and 20 μm in B’. Full details of numbers, precise P values, and statistical tests are reported in Excel file S1. Average data are shown as mean ± SEM. In some cases, the SEM symbol is smaller than the symbol for the mean. ****P < 0.001. NS, not significantly different.

