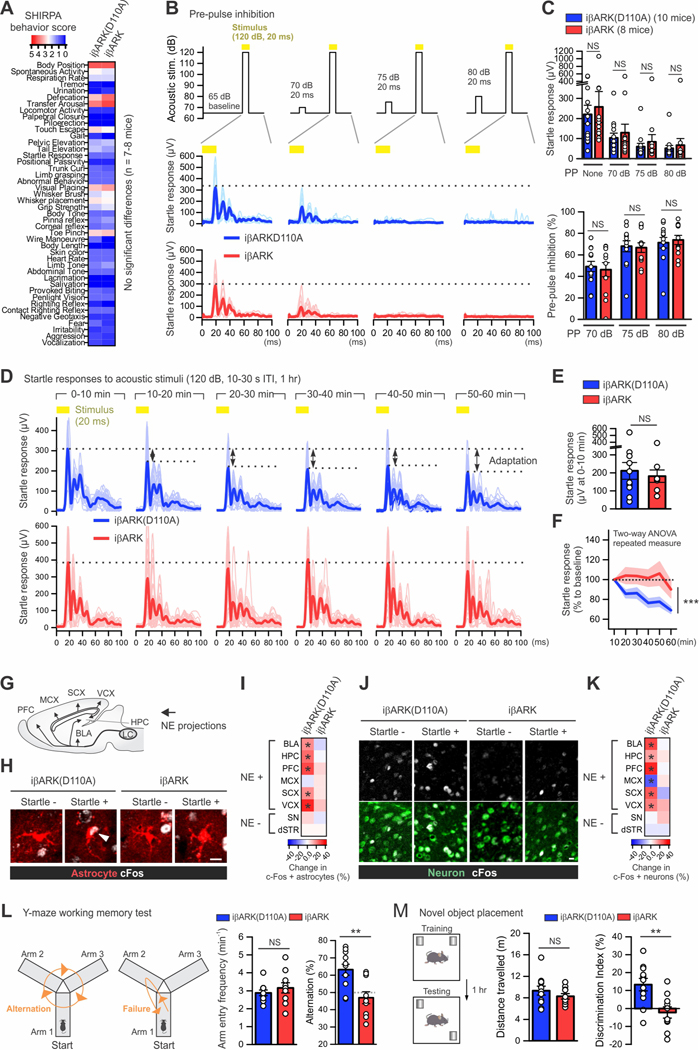
Figure 8. Brain-wide attenuation of astrocyte Gq pathway alters some mouse behavior.
(A) Heat map showing the behavioral scores of the SHIRPA battery for phenotype screening. n = 7–8 mice per group. (B) Pre-pulse inhibition test. Top, the amplitude and timing of acoustic stimuli with and without pre-pulse (70, 75 or 80 dB, 20 ms) that was initiated 100 ms prior to the stimulus (yellow; 120 dB, 20 ms). Center and bottom, mouse startle responses to the stimuli (yellow) obtained via the accelerometer. Plots in light colors shown individual data from each response, and those in dark colors and thicker lines indicate averaged data. (C) Top, summary plot of mouse startle responses to the stimuli with and without pre-pulses (PP). Bottom, summary plot of pre-pulse inhibition with different amplitude of pre-pulses. Mann–Whitney U test was used. (D) Startle adaptation. Mice were exposed to repetitive acoustic stimuli (yellow; 120 dB, 10–30 s inter-trial interval [ITI]) for 1 hour for assessing startle adaptation. The graph plots mouse startle responses in a iβARK(D110A) mouse and a iβARK mouse. Plots in light colors shown individual data from each response, and those in dark colors and thicker lines indicate averaged data over 10 min. (E-F) The graphs show the startle responses in iβARK(D110A) mice (10 mice) and iβARK mice (8 mice). (E) The startle responses during the first 10 min were not different between the 2 experimental groups. Mann–Whitney U test was used. (F) However, the startle response was progressively reduced over 1 hour (i.e. startle adaptation) in the iβARK(D110A) group but not in the iβARK group. Two-way repeated measures ANOVA was used. (G-I) Assessment of c-Fos expression in astrocytes in multiple brain areas of the iβARK(D110A) and iβARK groups with and without startle stimuli (n = 4 mice per group). Panel G schematize key brain areas receiving norepinephrine (NE) projections. (H) Images show astrocytes in the prelimbic prefrontal cortex (PFC) from each group. The arrowhead indicates c-Fos positive astrocytes. (I) Heat map on the right summarizes the change in c-Fos positive astrocytes assessed in such experiments. Locus coeruleus, LC; basolateral amygdala, BLA; hippocampus, HPC; prefrontal cortex, PFC; motor cortex, MCX; sensory cortex, SCX; visual cortex, VCX; substantia nigra, SN; dorsal striatum, dSTR. Mann–Whitney U test was used. (J-K) Assessment of c-Fos expression in neurons in multiple brain areas in indicated 4 experimental groups. (J) Images show that c-Fos in neurons of prelimbic PFC was significantly upregulated in the iβARK(D110A) group but not in the iβARK group. (K) Heat map on the right summarizes the change in c-Fos positive neurons assessed in such experiments. Mann–Whitney U test was used. (L) Y-maze test for assessing spatial working memory. The cartoons illustrating mice in Y-maze who can freely explore the arms. The left cartoon is an example of successful spontaneous alternation in explorations of arms which requires spatial working memory. The right cartoon illustrates a failed alternation. The left bar graph indicates that the frequency of arm entry was not different between groups. The right bar graph shows that the percentage of alternation in the iβARK group (10 mice) was below chance rate (50%) and significantly lower than in the iβARK (D110A) group (11 mice), indicating impaired working memory. Mann–Whitney U test was used. (M) Behavioral layout of the novel object placement task which requires spatial memory. Bar graphs show that the two indicated groups explored the arena similarly (left), however, the iβARK group displayed clear deficits in discrimination of familiar and novel place of objects (right). Mann–Whitney U test was used. Scale bars 10 μm in J and 20 μm in L. *P < 0.05. Full details of numbers, precise P values, and statistical tests are reported in Excel file S1. Average data are shown as mean ± SEM. **P < 0.01, ***P < 0.001. NS, not significantly different.

