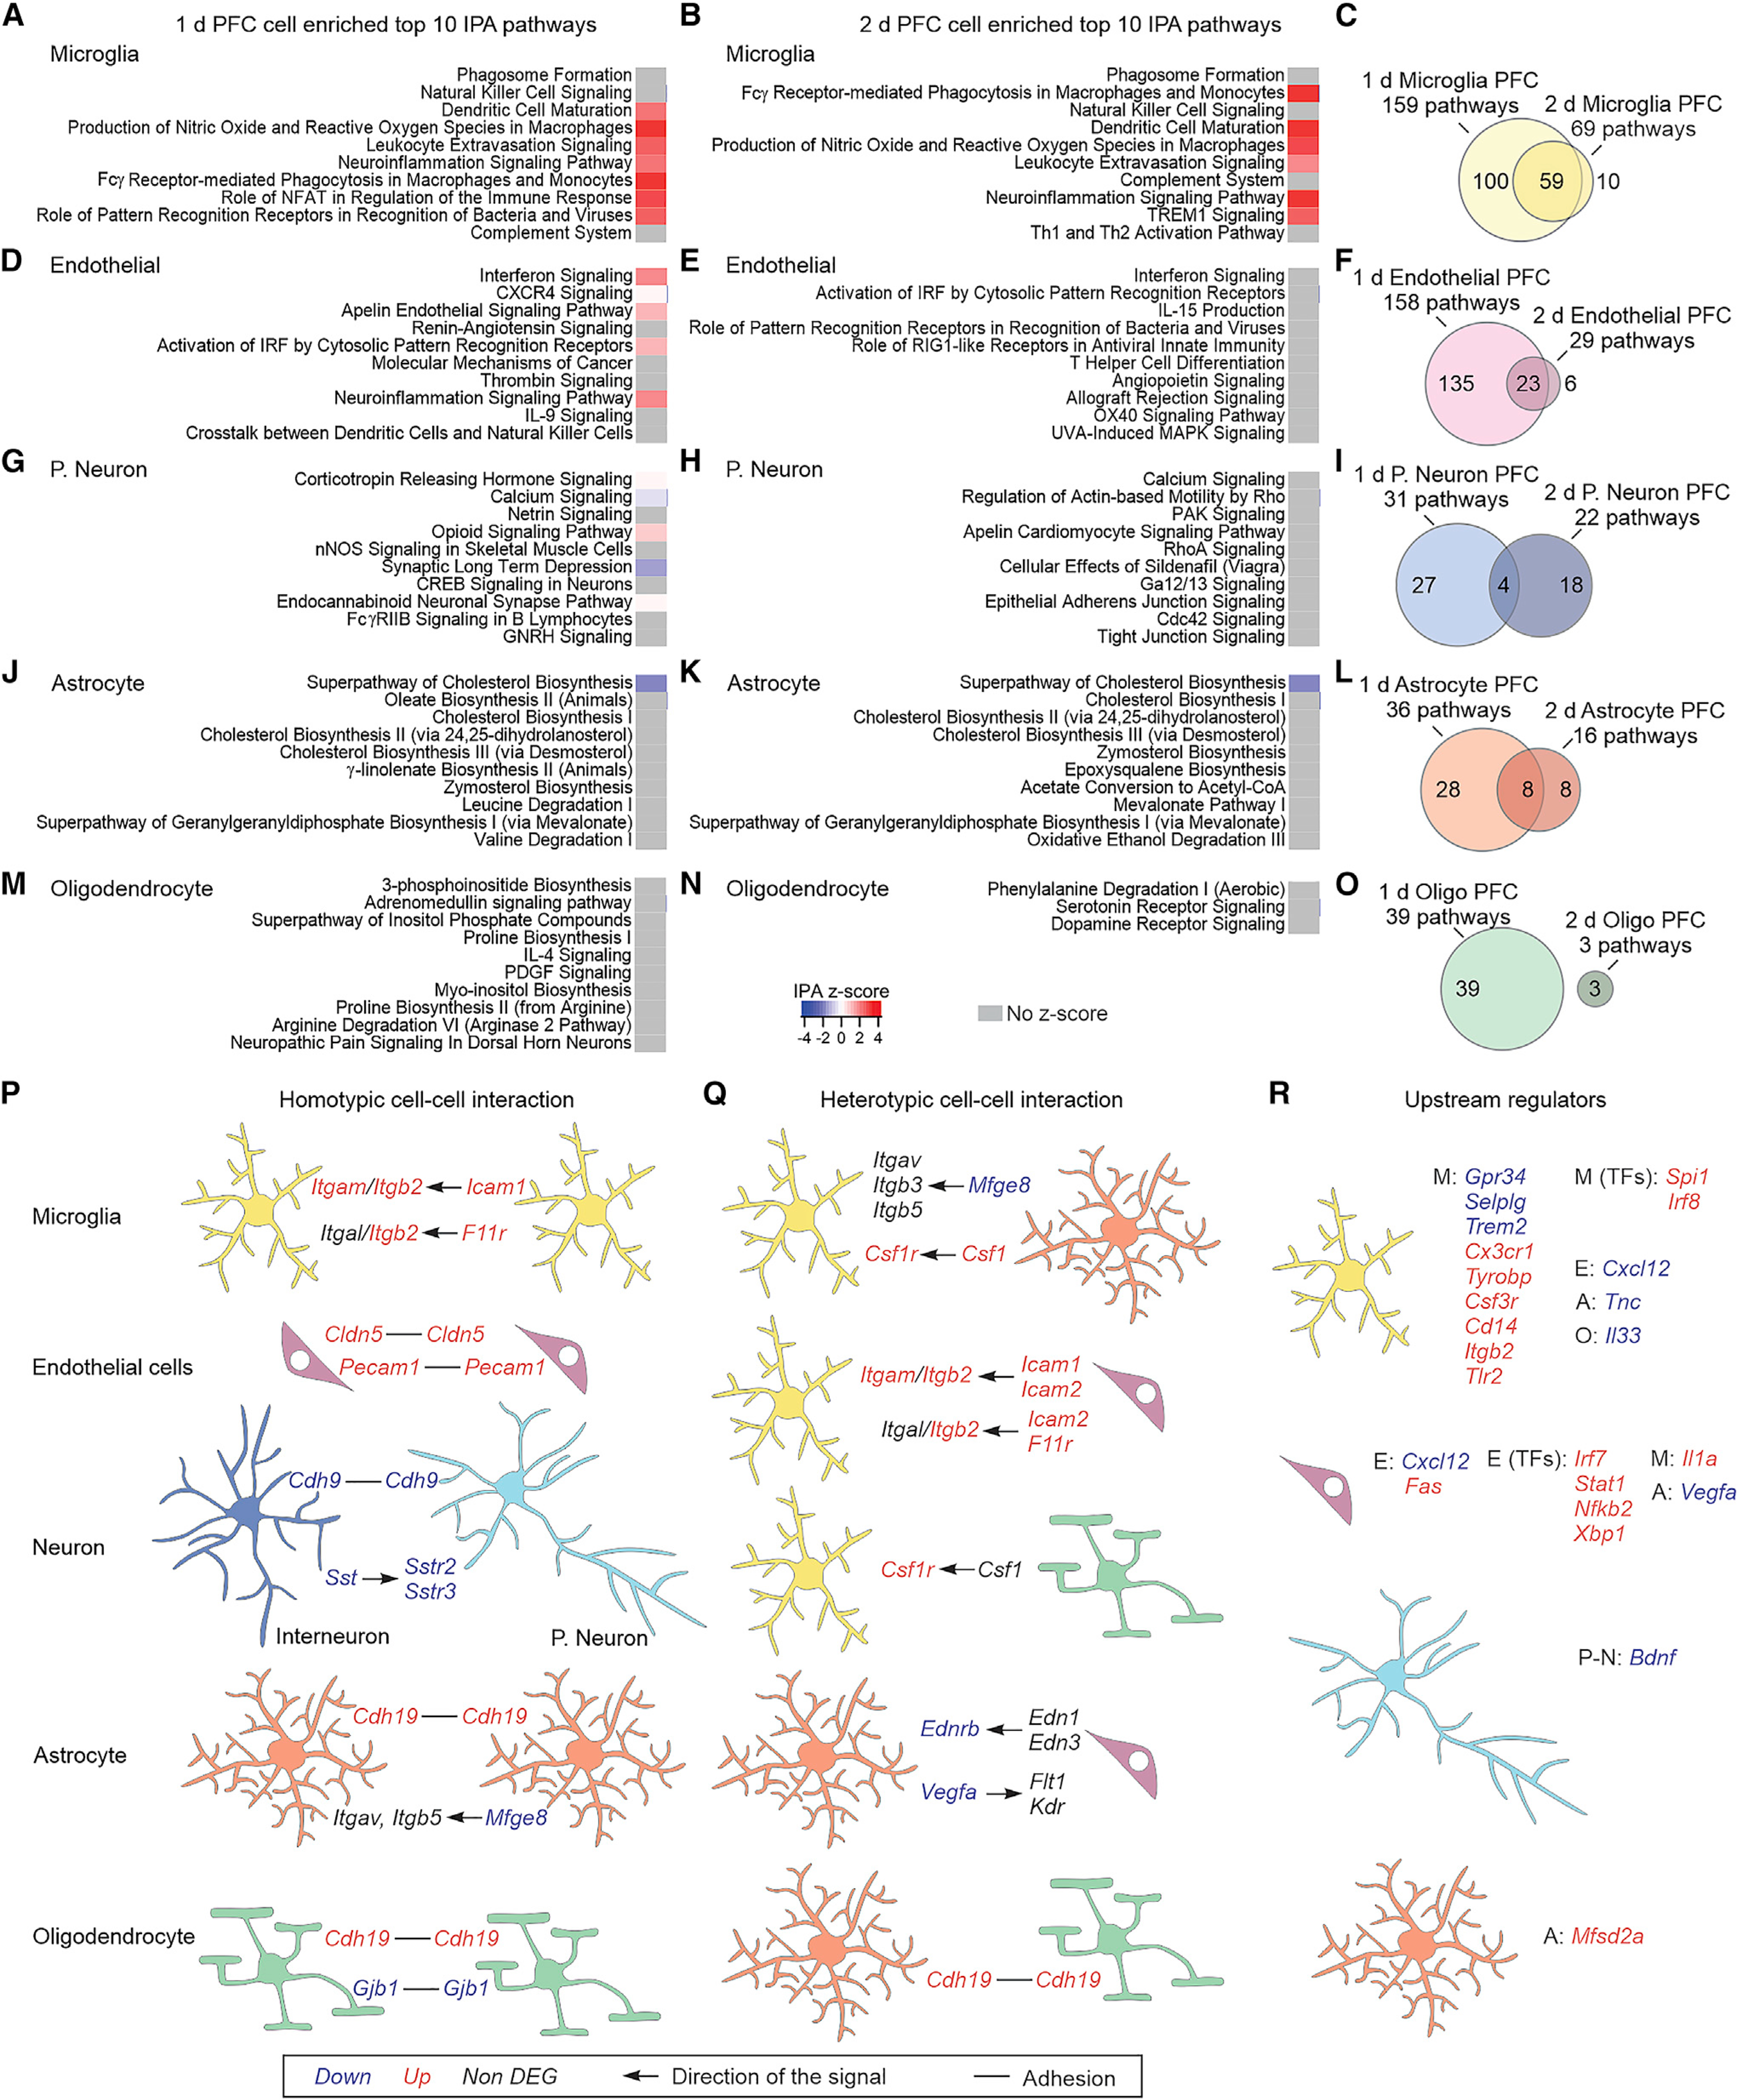
Figure 4. PFC cell-specific altered pathways and cell-cell interaction mechanisms.

(A and B) Top 10 IPA pathways identified for the microglia-enriched DEGs at 1 day (A) or 2 days (B).
(C) Overlap of the identified IPA pathways from microglia-enriched DEGs between 1 and 2 days.
(D–O) Same as (A)–(C) but for endothelial cells (D–F), projection neurons (G–I), astrocytes (J–L), or oligodendrocytes (M–O).
(P and Q) Homotypic (P) and heterotypic (Q) adhesion and ligand-receptor cell-cell interaction mechanisms that are altered in NIM. The arrows indicate the directionality of the signal, e.g., ligand → receptor.
(R) Differentially expressed upstream regulators of microglia, endothelial cells, projection neurons, and astrocyte DEGs. The upstream regulators could be receptors, ligands, or transcription factors (TFs) that are expressed in the same cell, or in the neighboring ones: microglia (M), endothelial cells (E), projection neurons (P-N), astrocytes (A), or dendrocytes (O).
For the whole figure, n = 3–4 biological samples per group; each biological sample was generated from tissue of two mice.
