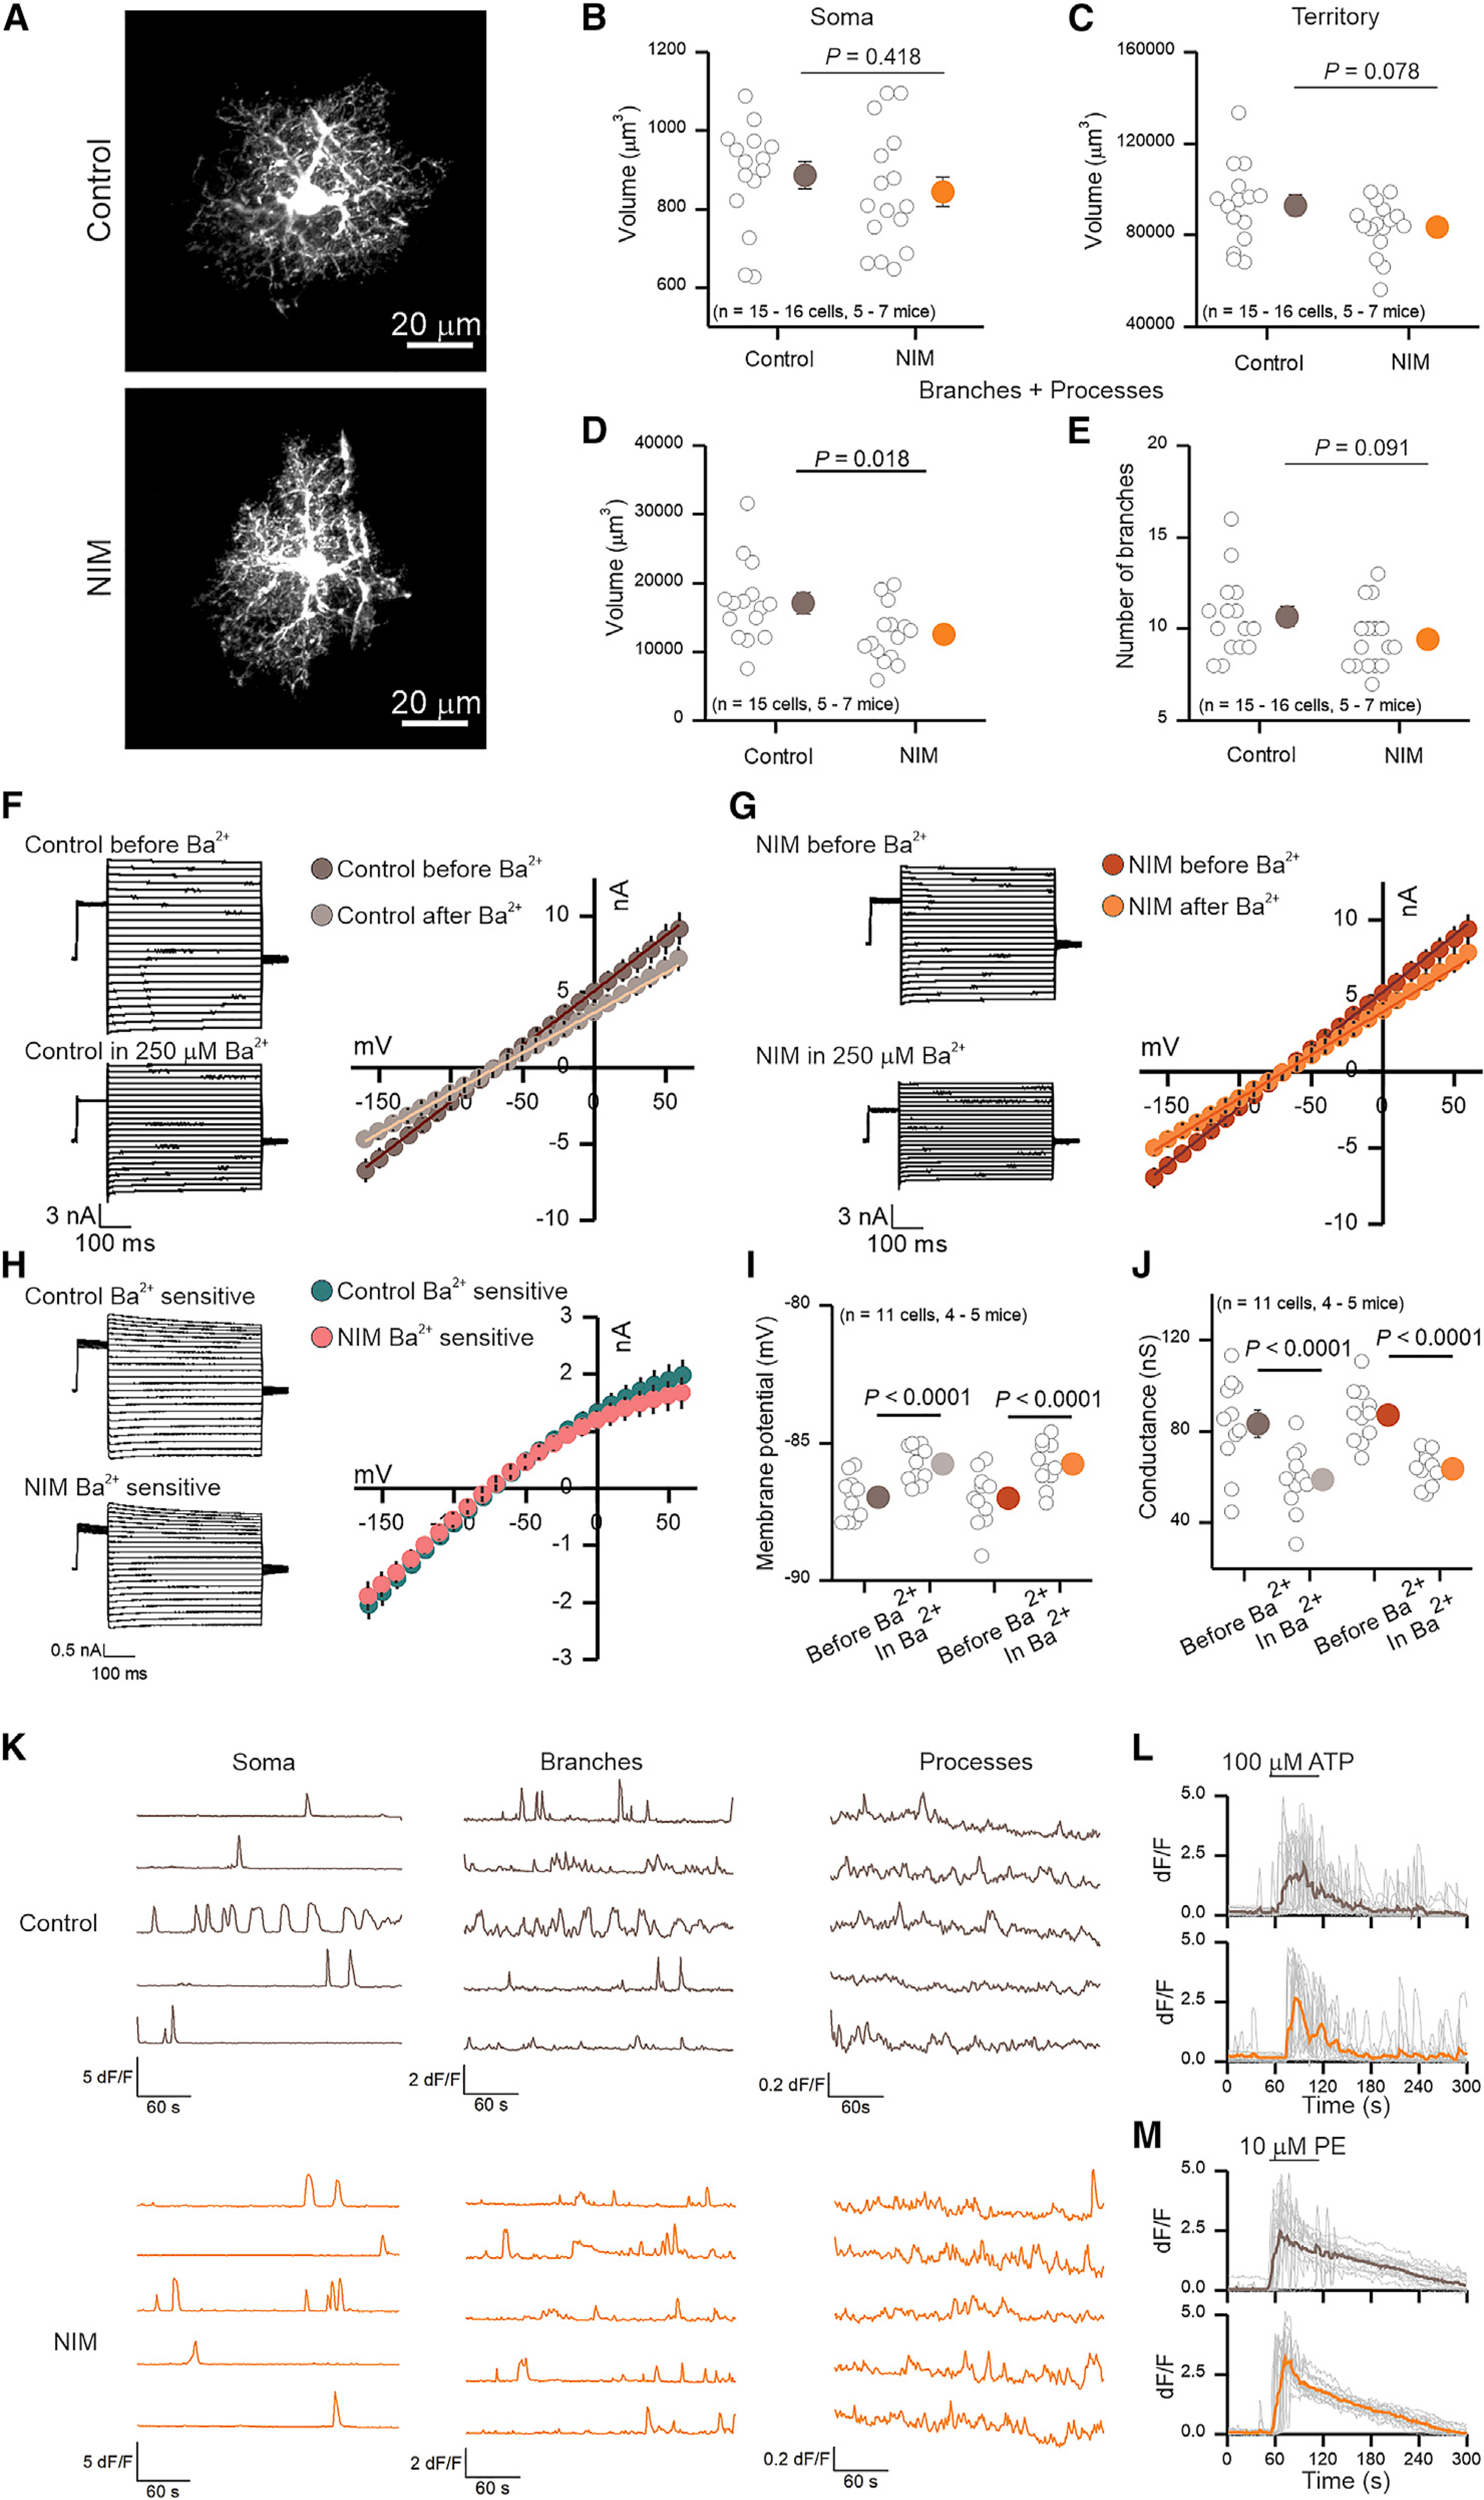
Figure 6. Functional and morphological alterations of PFC astrocytes during neuroinflammation.

(A) Representative images of 2-day control and NIM PFC astrocytes filled by lucifer yellow iontophoresis.
(B–D) Volume of soma (B), territory (C), and branches + processes (D) of 2-day control and NIM astrocytes. Cell compartment volumes were calculated with Imaris software.
(E) Number of branches that ramify from the soma of 2-day control and NIM astrocytes. n = 15–16 cells from five to seven mice per group.
(F and G) Whole-cell voltage clamp was performed on 2-day control (F) and NIM (G) astrocytes before and in the presence of 250 μM Ba2+. On the left, representative waveforms for total and Ba2+ insensitive currents are shown. On the right, average current-voltage relationships are shown.
(H) On the left, representative waveforms for control and NIM Ba2+-sensitive currents are shown. On the right, average current-voltage relationships for control and NIM Ba2+-sensitive currents are shown.
(I) Membrane potential of control and NIM astrocytes before and during Ba2+.
(J) Conductance of control and NIM astrocytes before and during Ba2+. n = 11 cells from four to five mice per group.
(K) Representative traces of 2-day control and NIM spontaneous Ca2+ signals (in 300 nM TTX) in soma, branches, and processes. The amplitude of Ca2+ signals is higher in control somas and branches than in NIM; however, Ca2+ signals are more frequent in the processes of NIM than in control (Table S1).
(L and M) Single (gray) and average (brown or orange) traces of astrocyte soma and branch Ca2+ increase in response to 1-min exposure to 100 μM ATP (L) or 10 μM phenylephrine (PE) (M).
In the scatterplots, open circles are raw data, with closed circles indicating mean ± SEM. In some cases, the error bars representing SEM are smaller than the symbol used for the mean. Scale bars, 20 μm.
