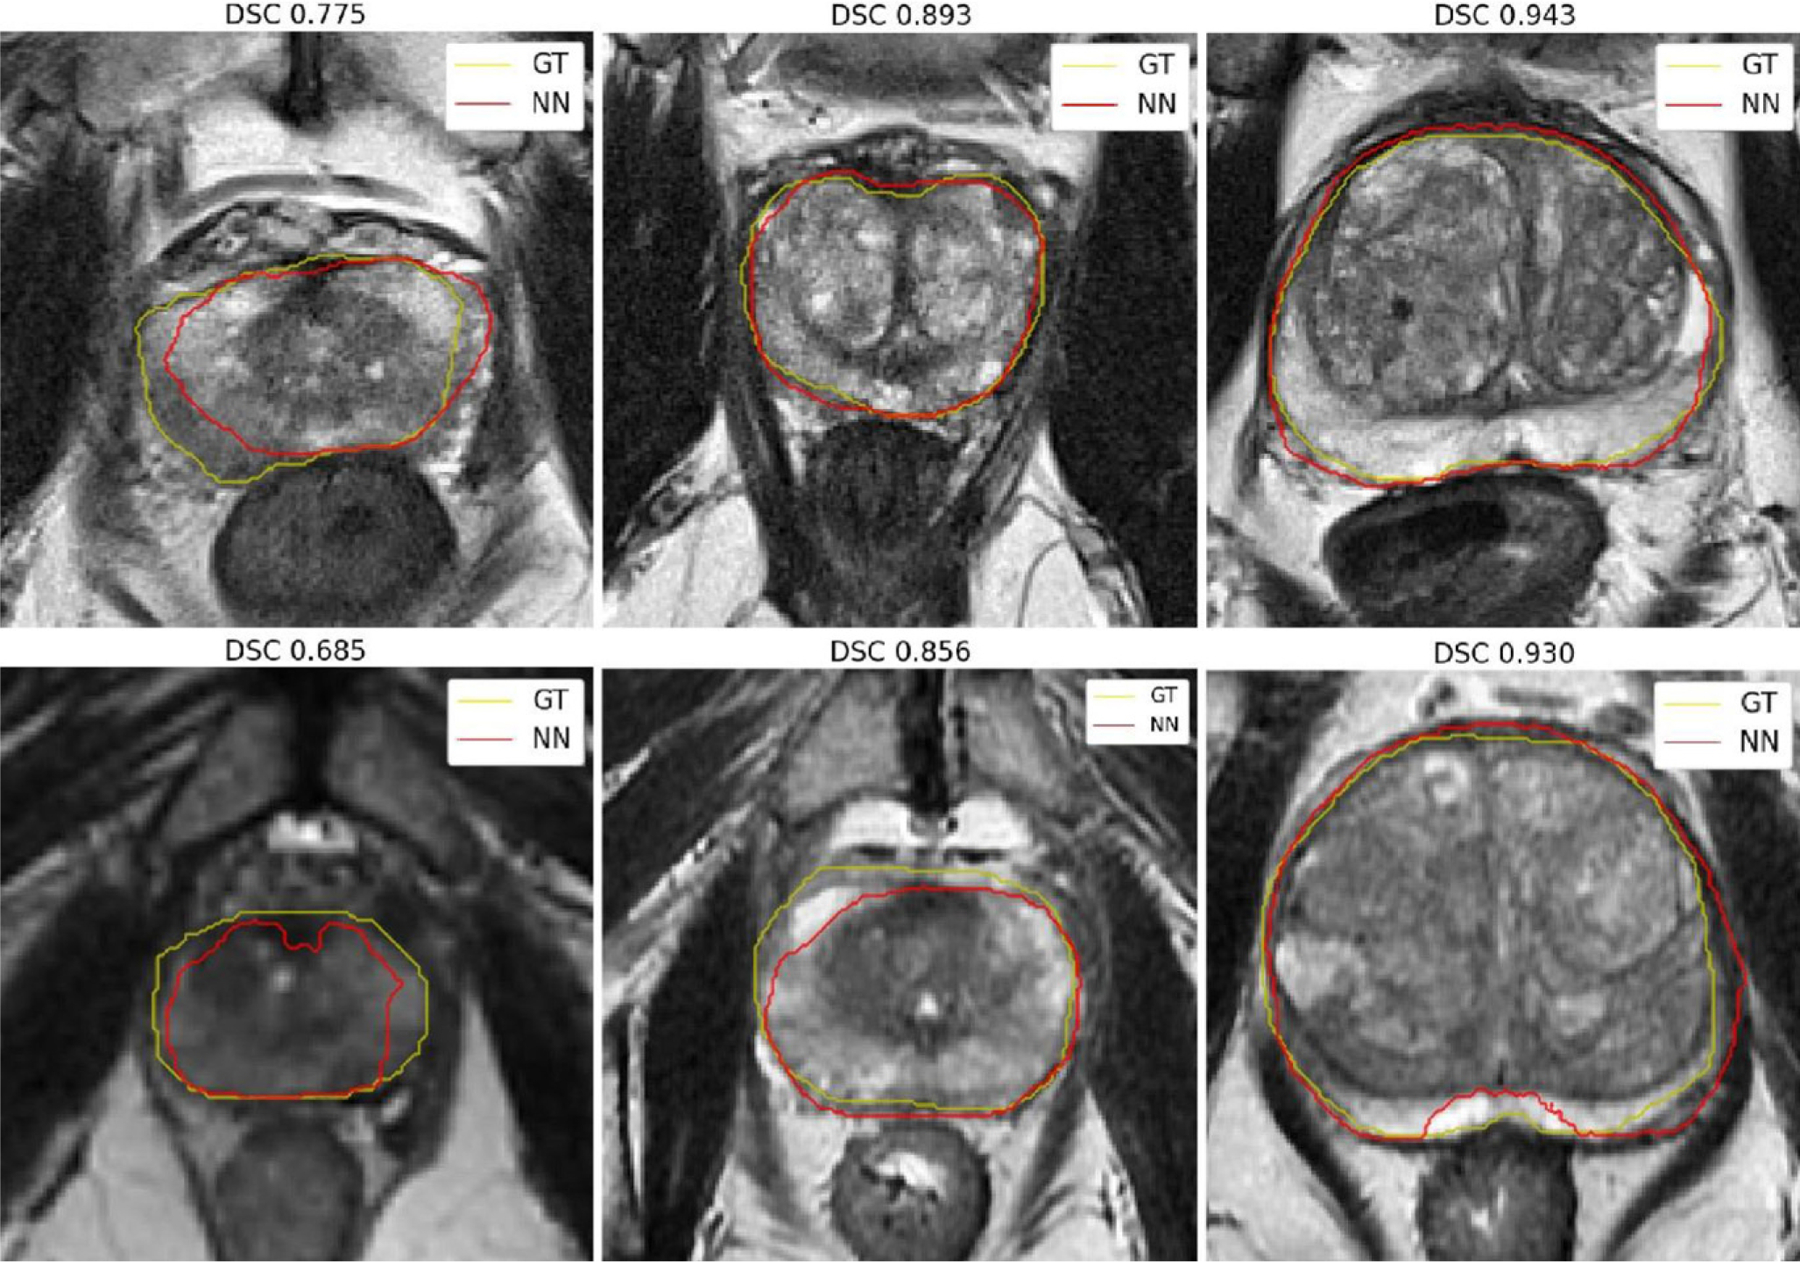
Fig. 4.

Prostate segmentation for the cases with the lowest, closest to mean, and highest 3D DSC for the Siemens (top) and GE (bottom) datasets. These segmentations are obtained with the Combined network model. Ground truth (GT) contours are in yellow and predicted contours (NN) are in red
