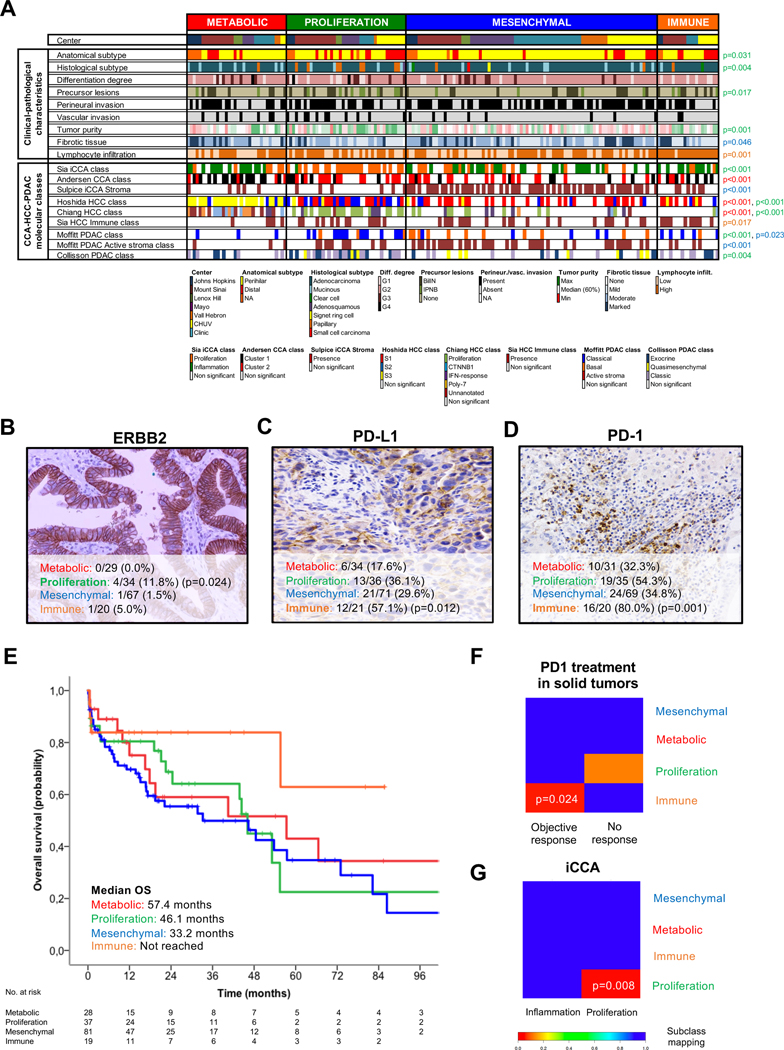
Fig. 3. Associations between eCCA molecular classes and clinical, pathological and molecular traits.
(A) Heatmap representing the clinical-pathological characteristics and previously described CCA-HCC-PDAC molecular classes for each single sample and grouped according to the proposed eCCA molecular classes. Tumor, stromal and immune cellularity was analyzed by pathological evaluation. Molecular classes described in other tumors were inferred using Nearest Template Prediction (NTP). P values were calculated using a two-sided Fisher’s exact test for categorical variables and T-test for categorical and continuous data. The color of p value identifies the molecular class (red: Metabolic; green: proliferation; blue: mesenchymal; and orange: immune) that presents significant differences when compared with the rest. Total number of eCCA samples per molecular class with a positive expression of (B) ERBB2 (circumferential membrane staining that is complete, intense, and within > 10% of tumor cells), (C) PD-L1 (membranous staining of tumor cells or stromal cells in >1% over the total number of cells) and (D) PD-1 (cytoplasmic staining of >5% lymphocytes over the total number of intra-tumoral lymphocytes) assessed by IHC. P values were calculated using a two-sided Fisher’s exact test between a specific molecular class and the rest. (E) Kaplan-Meier curves comparing OS in the four molecular eCCA classes. Subclass mapping comparing the transcriptome of the four molecular eCCA classes with external cohorts of: (F) solid tumors including melanoma, non-small cell lung carcinoma and head and neck squamous cell carcinoma treated with anti PD-1 monoclonal antibodies[54]; and (G) iCCA defining proliferation and inflammation classes[12]. P values were obtained after 100 random permutations and Bonferroni correction. CCA: Cholangiocarcinoma; iCCA: Intrahepatic cholangiocarcinoma; HCC: Hepatocellular carcinoma; PDAC: Pancreatic ductal adenocarcinoma; BilIN: Biliary intraepithelial neoplasia; IPNB: intraductal papillary neoplasm of the bile duct.

