
. 2021 Aug 28;2021:1940549. doi: 10.1155/2021/1940549
Copyright © 2021 LiLi Liu et al.
This is an open access article distributed under the Creative Commons Attribution License, which permits unrestricted use, distribution, and reproduction in any medium, provided the original work is properly cited.
Figure 1.
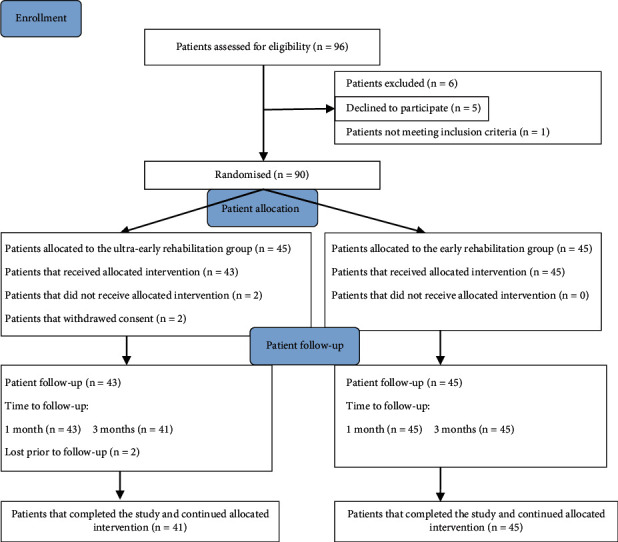
Flowchart of the study population.