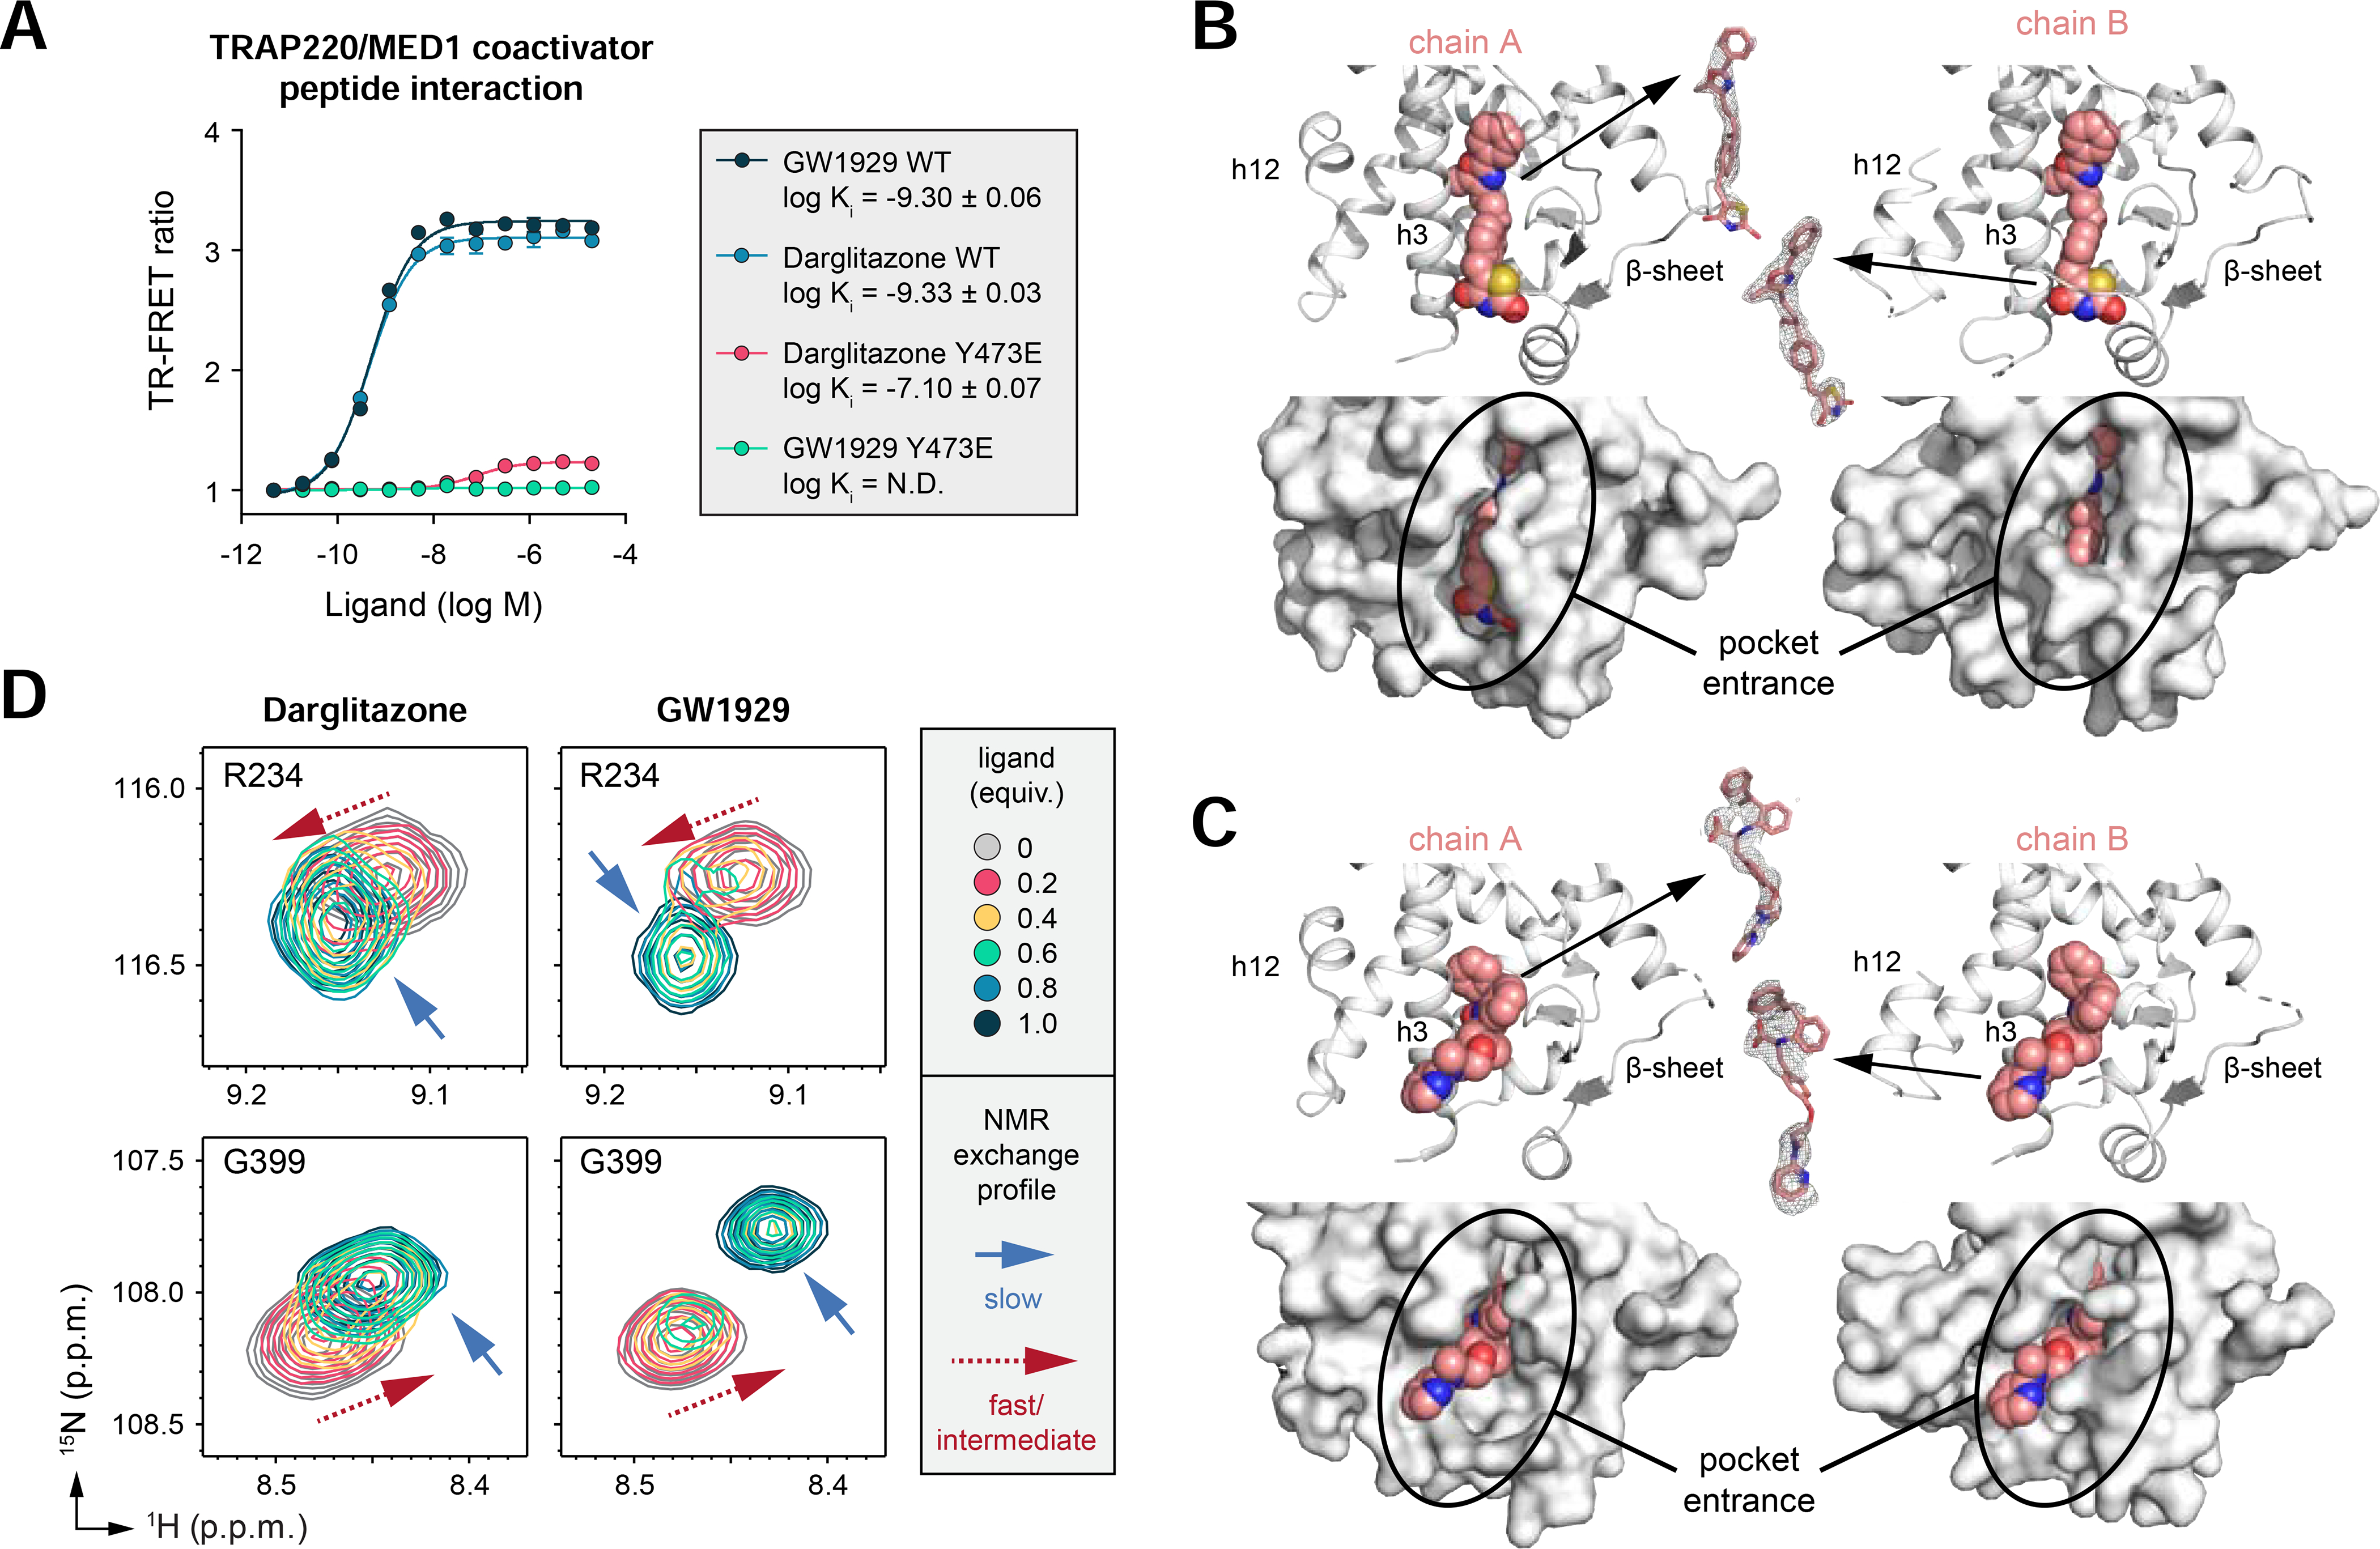
Figure 6. Ligand binding analysis to [Y473E]-PPARγ LBD.

(A) TR-FRET coregulator interaction assay characterizing the activity of two full agonists, darglitazone and GW1929, on the interaction of a peptide derived from the TRAP220/MED1 coactivator protein to either wild-type (WT) PPARγ LBD or [Y473E]-PPARγ LBD. Data are presented as mean ± SEM (n = 3). (B,C) Soaking of darglitazone (B) or GW1929 (C) into preformed apo-[Y473E]-PPARγ LBD crystals reveals the ligands bind only to the orthosteric pocket ligand entry site in both chain A and B (pink ligand). Insets show ligand 2Fo-Fc maps contoured at 1σ, and key structural elements are labeled. (D) Snapshots of 2D [1H,15N]-TROSY-HSQC NMR spectra of 15N-labeled [Y473E]-PPARγ LBD in the absence or presence of increasing concentrations of darglitazone or GW1929. See also Figures S6–S8.
