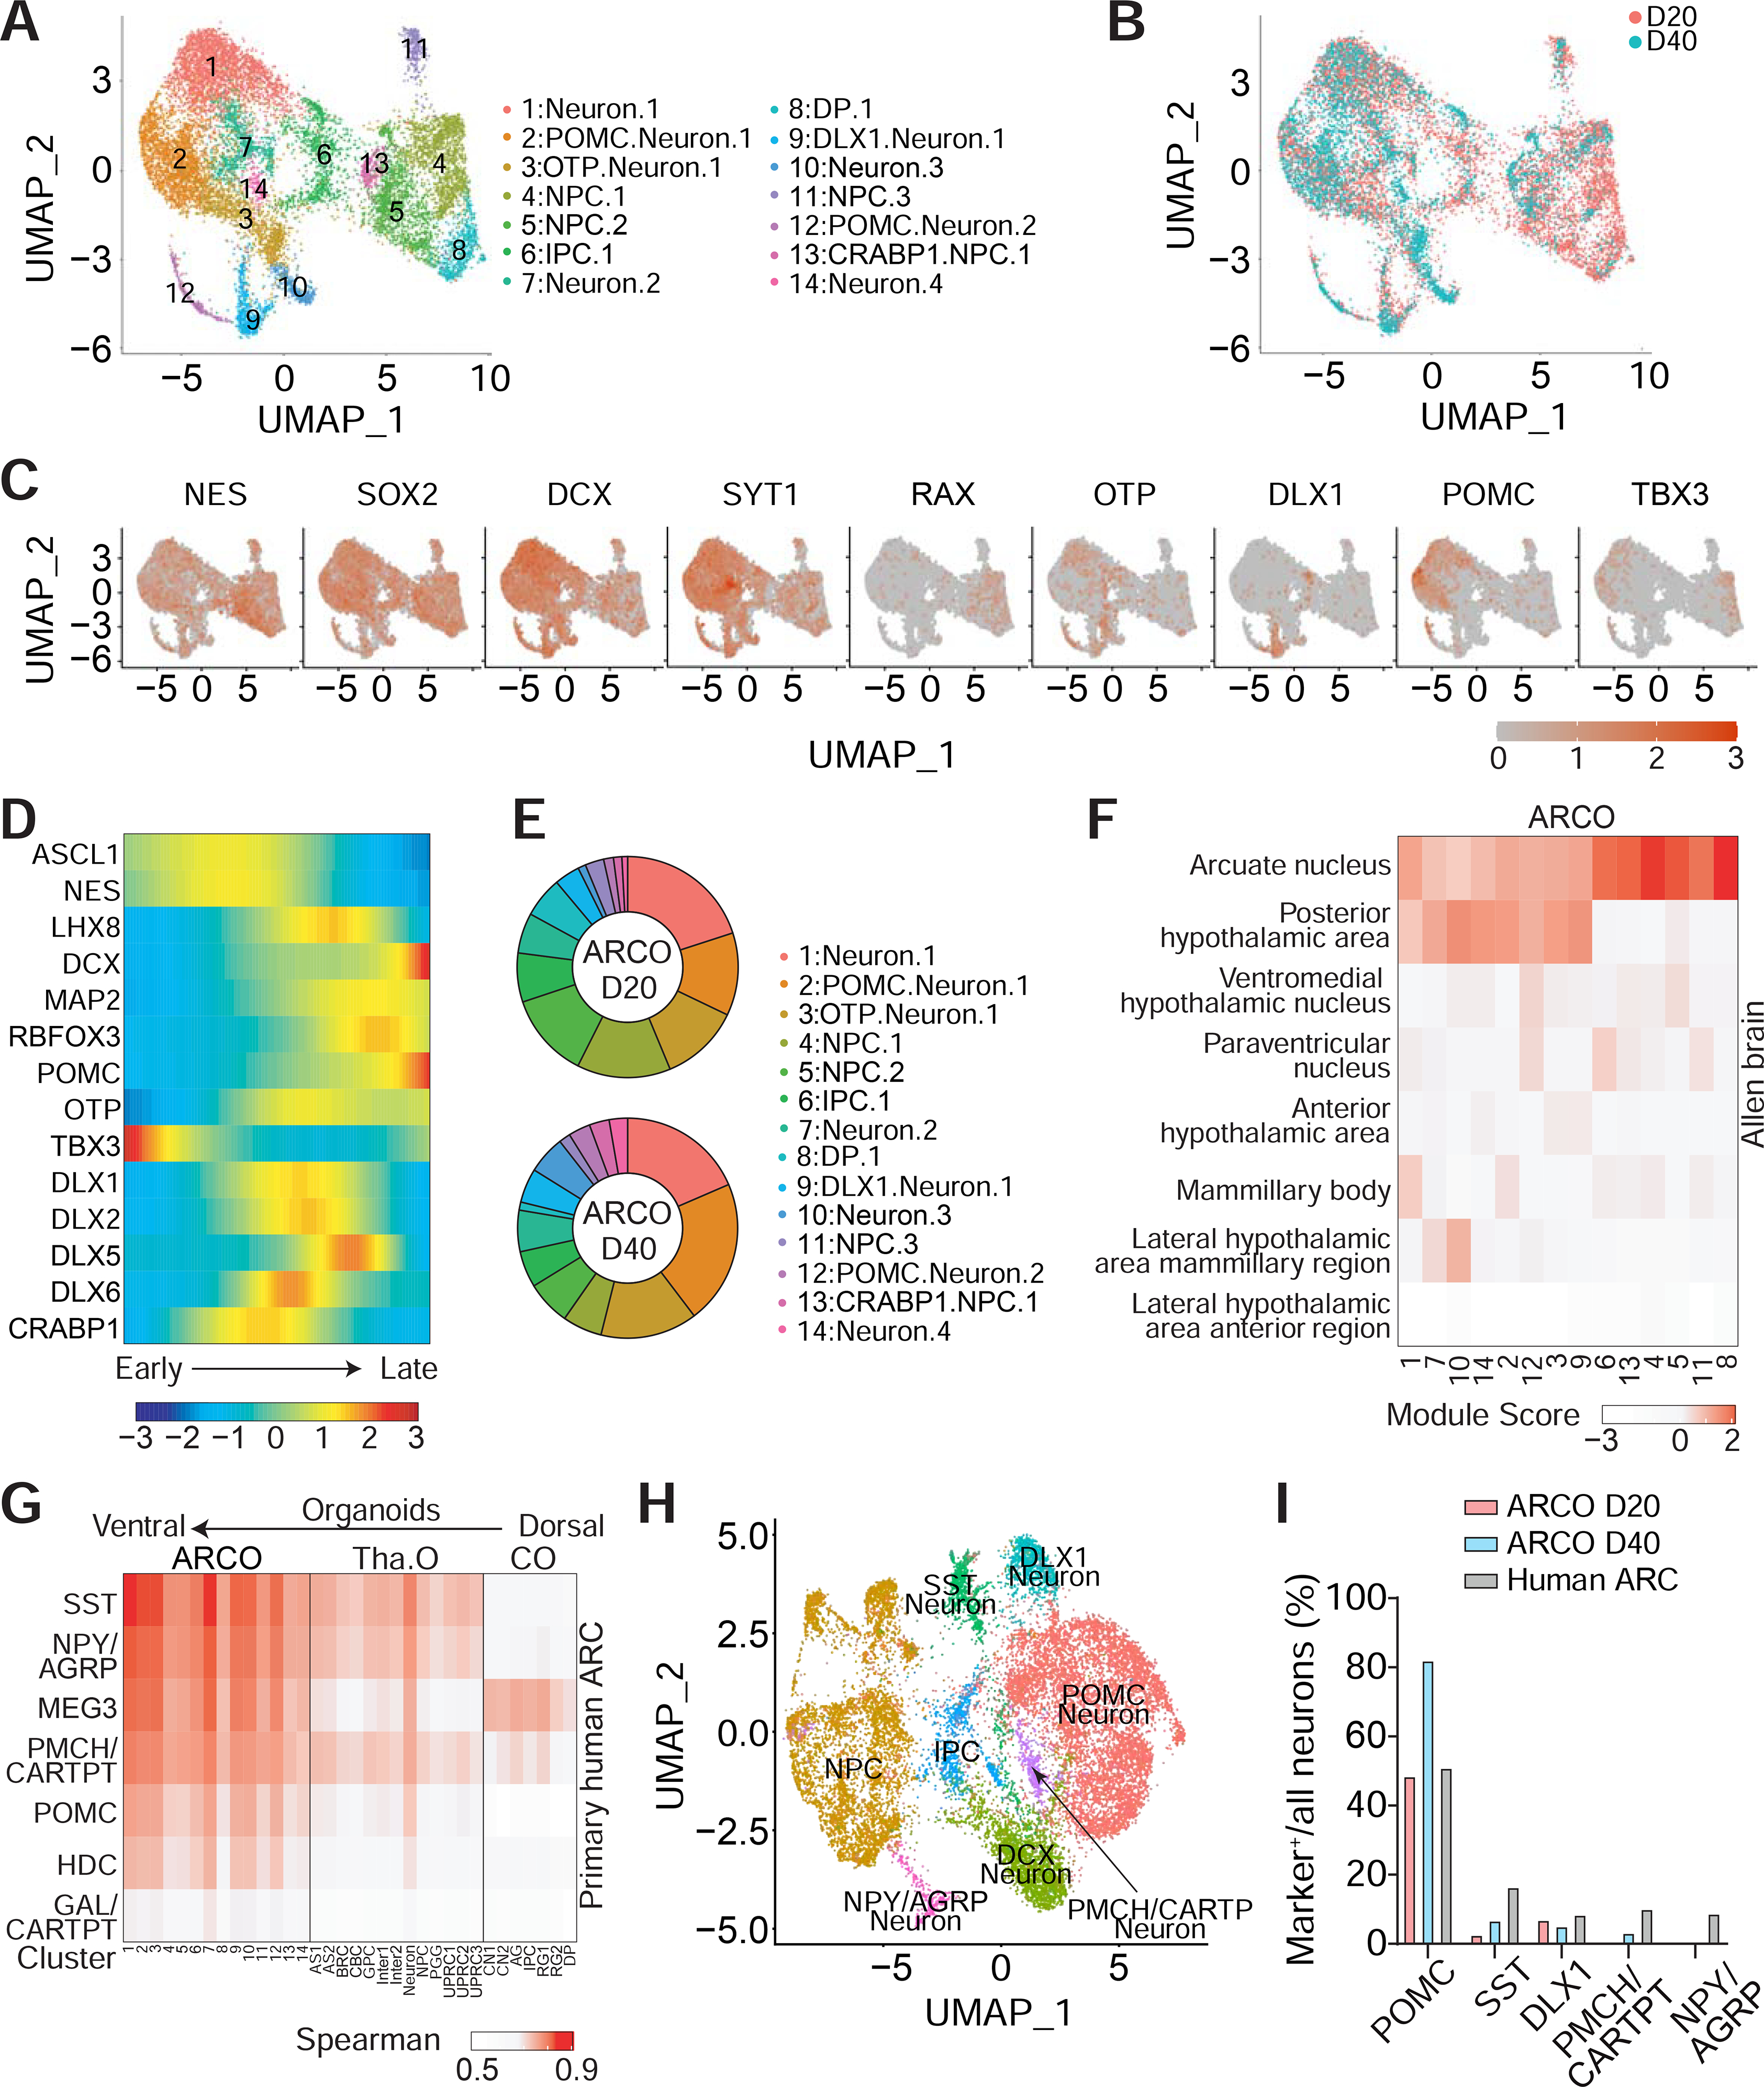
Figure 2. Single-Cell RNA-Seq Analyses of ARCOs.

(A-C) Sample UMAP plots of single-cell RNA-seq analysis of ARCOs at 20 and 40 DIV, colored and labeled by cluster (A) or by timepoint (B), and representative feature plots of genes expressed in ARCOs (C).
(D-E) Pseudotime trajectory analysis of selected genes in ARCOs (E) and proportion of cellular subtypes in ARCOs at 20 and 40 DIV (E).
(F) Heatmap showing average module scores across all ARCO clusters for each hypothalamic nuclei-specific gene list compiled from the published Allen Brain Adult Human database (Hawrylycz et al., 2012; Jones et al., 2009; Shen et al., 2012; Sunkin et al., 2013), plotted as the column Z-score per ARCO cluster for visualization. See Methods section for detailed explanation of the module score.
(G) Transcriptomic comparison of the predicted human ARC neuronal subtypes with different cell clusters from ARCOs, thalamus organoids (Tha. O) (Xiang et al., 2019) and neocortical organoids (CO) (Qian et al., 2020).
(H-I) Integrated analysis of single-cell RNA-seq of ARCOs and predicted neonatal human ARC populations. Shown are UMAP of different clusters of the integrated dataset (H) and quantification of different neuronal subtypes as percentages of total neurons from ARCOs at 20 or 40 DIV and predicted human neonatal ARC populations (I).
