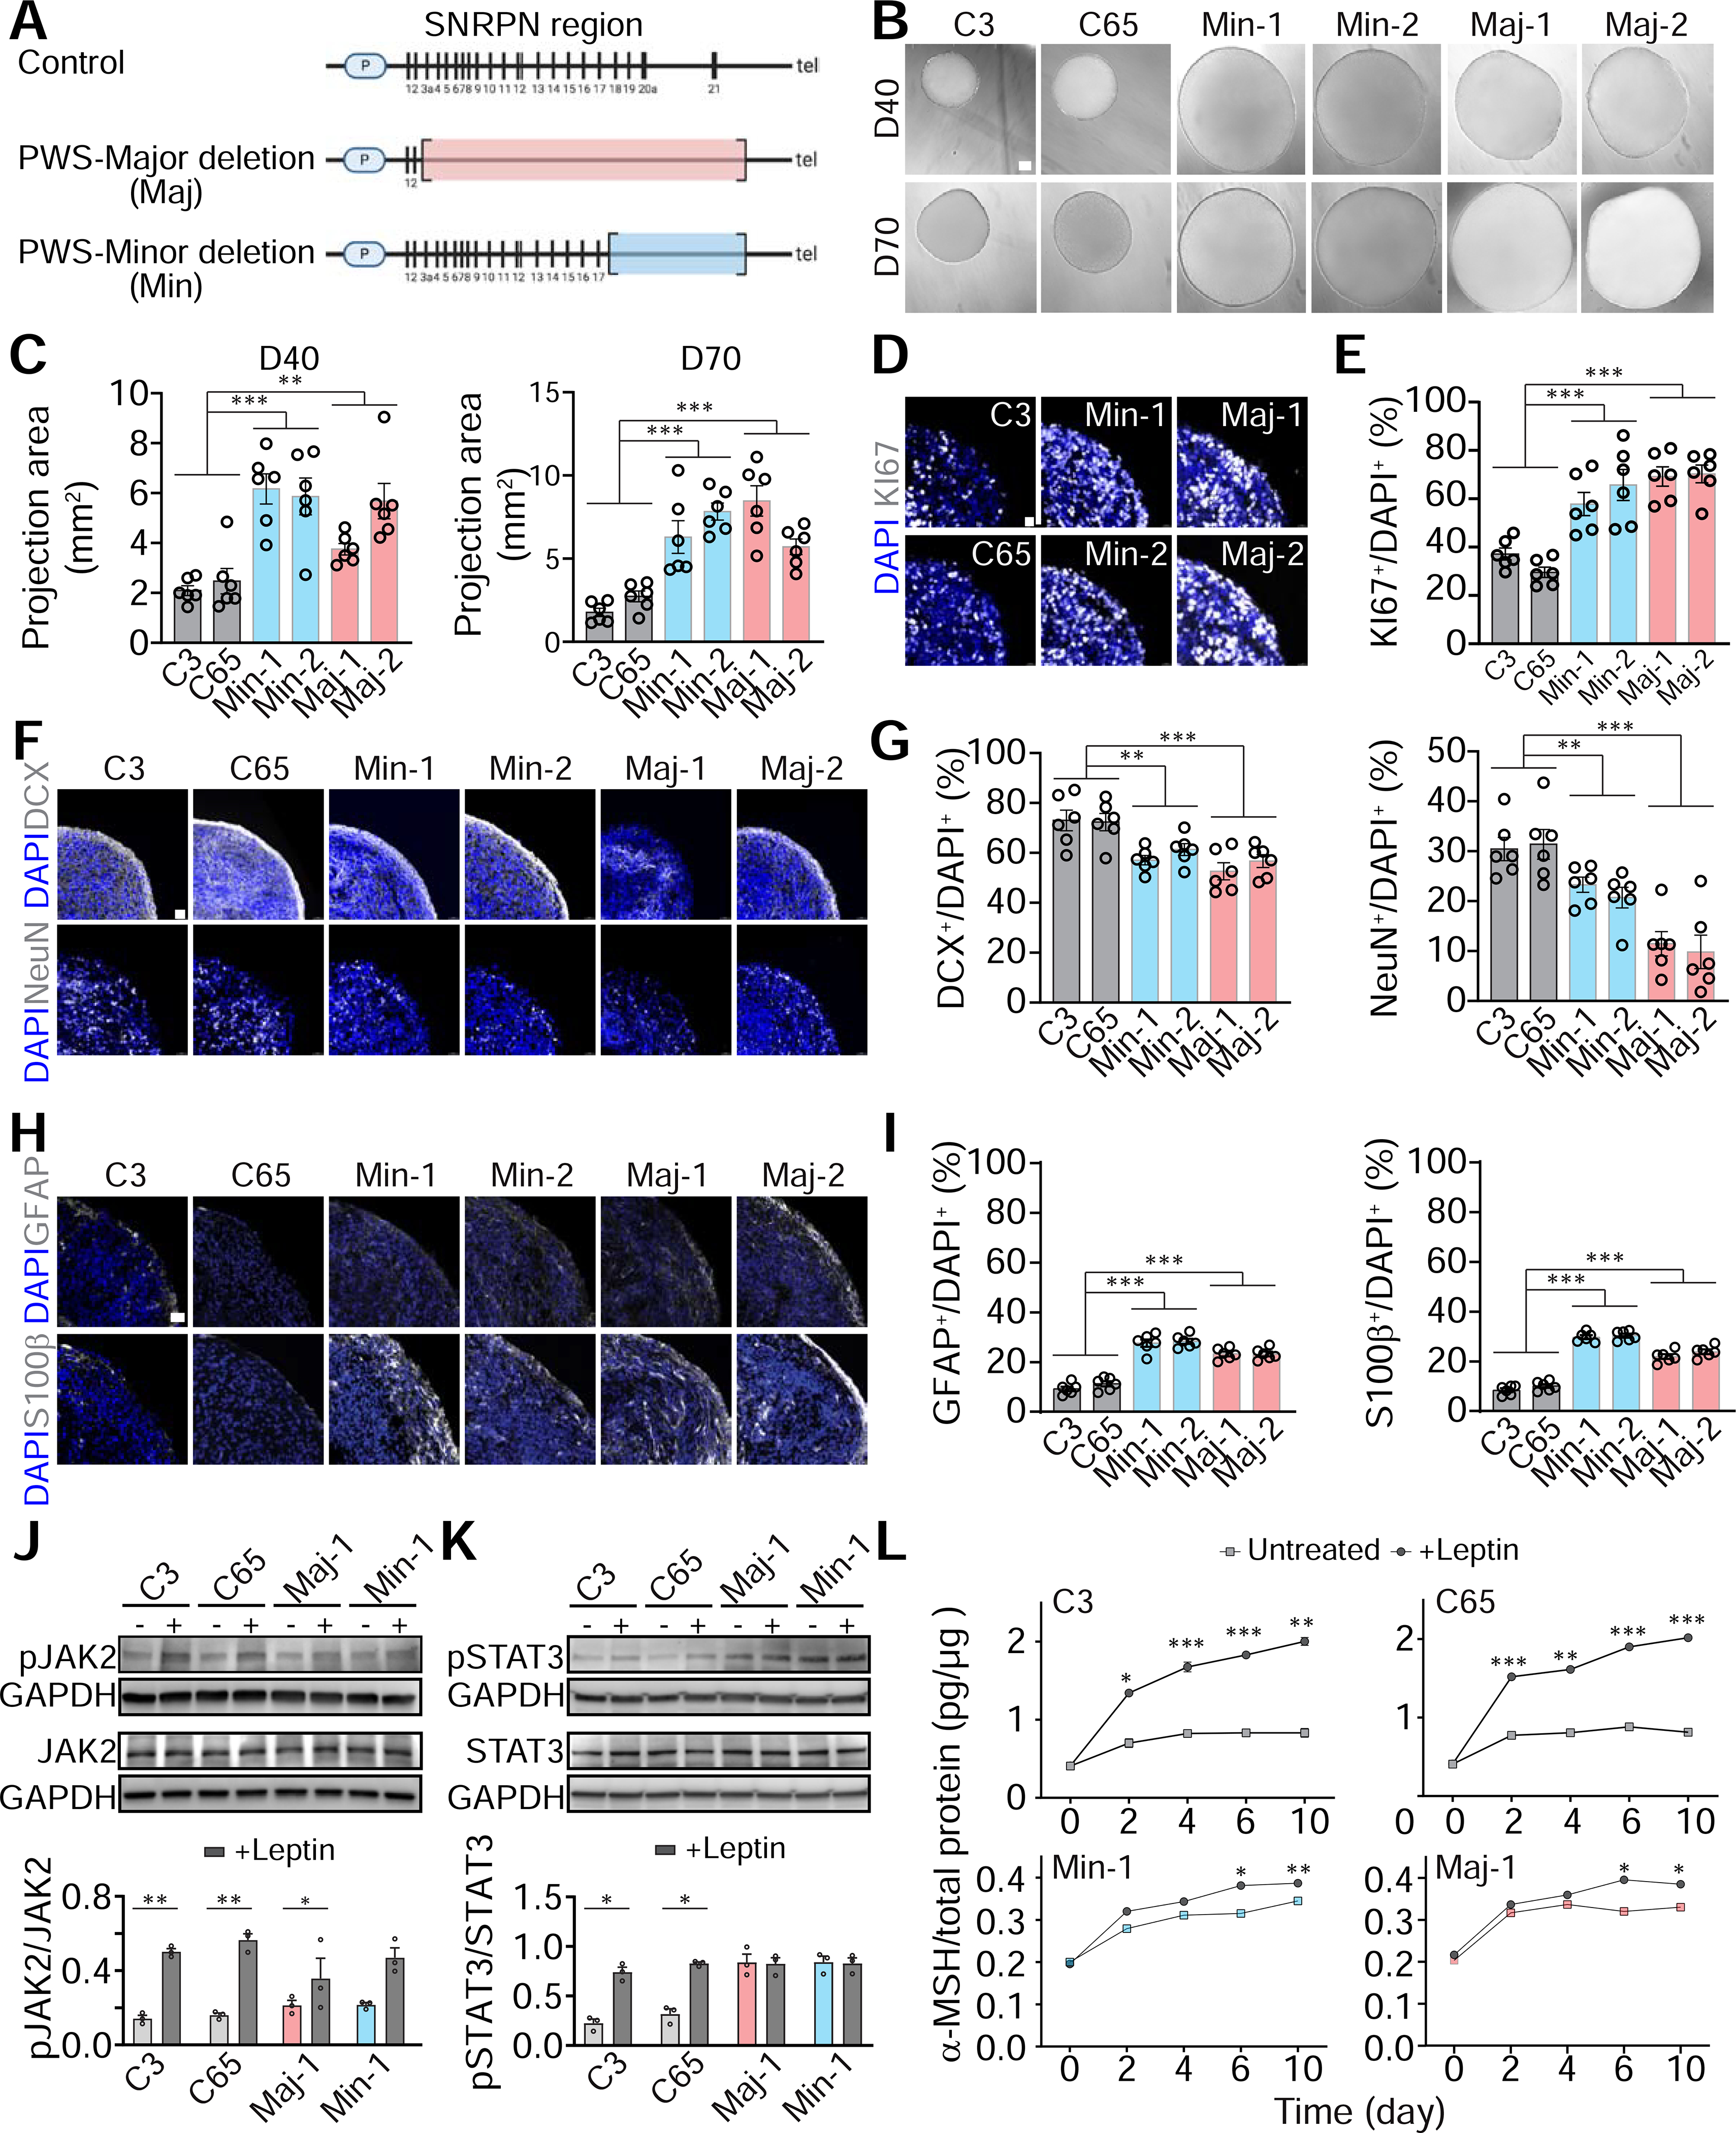
Figure 3. Aberrant Differentiation and Leptin Responses of ARCOs Derived from PWS Patient iPSCs.

(A) Schematic map of the human paternal chromosome region 15q11-q13 comparison between control, PWS major and minor deletion iPSC lines.
(B-C) Sample bright-field images of ARCOs generated from control and PWS iPSC lines at 40 and 70 DIV (B, scale bar, 300 μm) and quantification of projected area (mm2; C). Values represent mean ± SEM with individual data points plotted (n = 6 organoids per iPSC line; **p < 0.01; ***p < 0.001; One-way ANOVA)
(D-I) Sample confocal images of immunostaining for KI67 in ARCOs from control and PWS iPSC lines at 15 DIV (D, scale bar, 15 μm), for DCX and NeuN at 40 DIV (F, scale bar, 30 μm), for GFAP and s100β at 100 DIV (H, scale bar, 20 μm), and quantifications (E, G, I). Values represent mean ± SEM with individual data points plotted (n = 6 organoids per iPSC line; **p < 0.01; ***p < 0.001; One-way ANOVA).
(J-K) Leptin-induced activation of JAK2 (J) and STAT3 (K) signaling pathway. ARCOs at 60 DIV were treated with Leptin (2 μg/ml) and lysates were subject to Western blot analysis 1 hr later. Shown are sample Western blot images (top panel) and quantification (bottom panel). Values represent mean ± SEM (n = 3; *p < 0.05; ***p < 0.01; Paired t test).
(L) Leptin-induced release of MCH. ARCOs at 60 DIV were treated with Leptin (2 μg/ml) every two days and conditioned medium was subjected to ELSA analysis of MCH. Values represent mean ± SEM (n = 3; *p < 0.05; **p < 0.01; ***p < 0.001; Paired t test).
