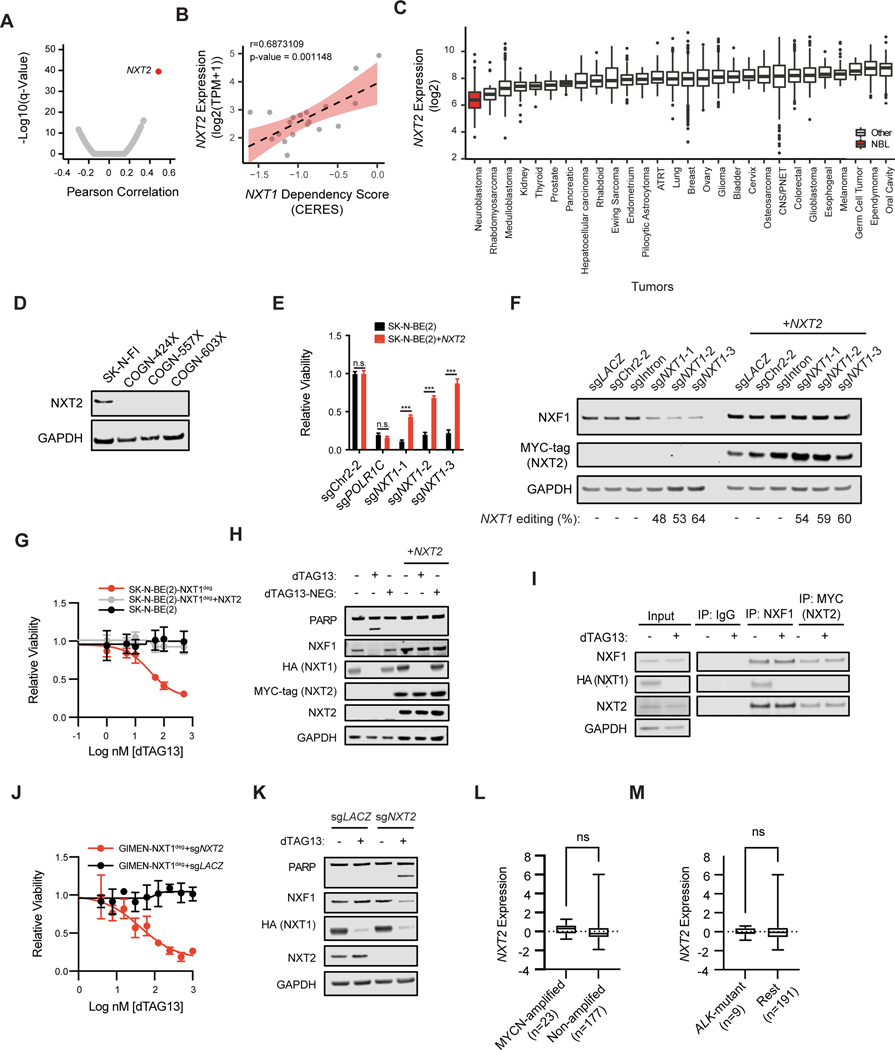
Figure 4. Low NXT2 expression is necessary and sufficient for NXT1 dependency in neuroblastoma.
A, Pearson correlations were calculated for gene expression and NXT1 dependency for all genes and cell lines in the DepMap dataset. Volcano plot indicates the Pearson correlation on the x-axis and the -log10 of the q-value on the y-axis. Each dot indicates a different gene. In red, NXT2, the gene whose expression is most significantly associated with NXT1 dependency is shown. B, The correlation between NXT2 expression and NXT1 dependency in neuroblastoma cell lines in DepMap is shown. The y-axis indicates the expression of NXT2 in log2 transcripts per million (TPM) +1. The x-axis indicates the scaled-CERES score for NXT1. Each data point indicates a different neuroblastoma cell line (n=19). The Pearson correlation coefficient and p-value are shown at the top. The best-fit line is plotted as a dotted line. C, NXT2 expression (log2 transformed, y-axis) was assessed across the R2 database of microarray data (u133p2, MAS5.0) from patient tumor samples. Data sets in the same cancer type were collapsed for clarity. Cancer type is shown on the x-axis. Sample sizes are as follows: Neuroblastoma (n=233), Breast (n=1994), ATRT (n=67), Bladder (n=93), Cervix (n=351), CNS/PNET (n=206), Colorectal (n=2182), Endometrium (n=209), Ependymoma (n=376), Esophogeal (n=40), Ewing Sarcoma (n=154), Germ Cell Tumor (n=13), Glioblastoma (n=200), Glioma (n=607), Hepatocellular Carcinoma (n=91), Kidney (n=261), Lung (n=514), Medulloblastoma (n=350), Melanoma (n=44), Oral Cavity (n=103), Osteosarcoma (n=27), Ovary (n=787), Pancreatic (n=32), Pilocytic Astrocytoma (n=41), Prostate (n=71), Rhabdoid (n=51), Rhabdomyosarcoma (n=58), Thyroid (n=34). D, Western blot showing NXT2 and GAPDH levels in three neuroblastoma patient-derived xenograft models (COGN-424X, COGN-557X, COGN603X). The NXT2-high cell line SK-N-FI serves as a positive control. E, The relative viability effect of the indicated sgRNAs after seven days of growth is shown as the mean +/− stdev. In black is SK-N-BE(2) parental, in red is SK-N-BE(2) over-expressing a MYC-tagged NXT2. sgPOLR1C-1 targets the essential gene POLR1C. n.s. indicates a p-value of >0.05 in a two-way ANOVA followed by Tukey’s multiple comparison test, while *** indicates a p-value of <0.001 (degrees of freedom =50). F, Western blot depicting NXF1, MYC-tagged exogenous NXT2, and GAPDH levels in SK-N-BE(2) cells 5 days after infection with the indicated CRISPR guides. CRISPR editing of the NXT1 locus is shown below as determined using the TIDE algorithm. G, Dose response curve for dTAG13 in parental SK-N-BE(2) (black) SK-N-BE(2)-NXT1deg (red, endogenous NXT1 knocked out, degradable NXT1 exogenously expressed), and SK-N-BE(2)-NXT1deg+NXT2 (endogenous NXT1 knocked out, degradable NXT1 exogenously expressed, and NXT2 exogenously expressed). H, Western blot depicting PARP, NXF1, HA-NXT1, MYC-tagged NXT2, and GAPDH levels after 24 hours of treatment with DMSO, 500 nM dTAG13, or 500 nM of dTAG13-NEG, an inactive form of dTAG13, as indicated at the top. At left is SK-N-BE(2)-NXT1deg, at right SK-N-BE(2)-NXT1deg+NXT2. I, Immunoprecipitations were performed using antibodies targeting mouse IgG, NXF1 and MYC (NXT2) six hours after DMSO or 500 nM dTAG13 treatment, as indicated in the KELLY-NXT1deg cell line overexpressing NXT2. Input lysate is shown to the left. NXF1, NXT2, HA (NXT1), and GAPDH levels are shown. J, Dose response curve for dTAG13 in GIMEN- NXT1deg with a non-targeting sgRNA (sgLACZ, black) and GIMEN-NXT1deg with a sgRNA targeting NXT2 (sgNXT2, red) after 72h of treatment. Y-axis indicates relative viability and x-axis indicates log of nM dose of dTAG13. K, Western blot in GIMEN- NXT1deg after infection with indicated sgRNA 24 hrs after treatment with DMSO or 500 nM dTAG13 as indicated. L, NXT2 expression Z-score for 200 neuroblastoma tumor samples in the Gabriella Miller Kid’s First (GMKF) dataset is shown on the y-axis. Samples are binned according to MYCN copy number as indicated. A t-test with Welch’s correction was not significant (n.s.). M. As in L, NXT2 expression for the GMKF dataset is shown on the y-axis, and samples are binned based on whether they contain a putative driver mutation in ALK. A t-test with Welch’s correction was not significant (n.s.).

