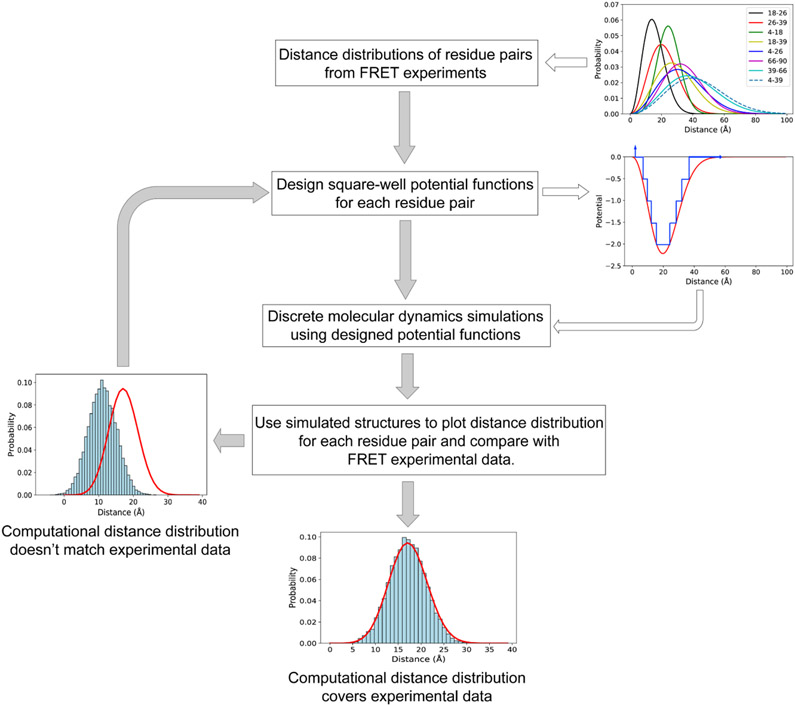
Figure 1. The schematic workflow of predicting protein conformations by the combination of trFRET and DMD simulations.
The distance distributions of the eight residue pairs are retrieved from the trFRET experiment (Grupi and Haas, 2011a). In the subplot of potential and distance, the red line indicates the continuous potential and the blue line represents the designed discrete step function potential. In the two bottom subplots, the red line indicates the experimental data and the blue histogram represents the computational distance distribution.

