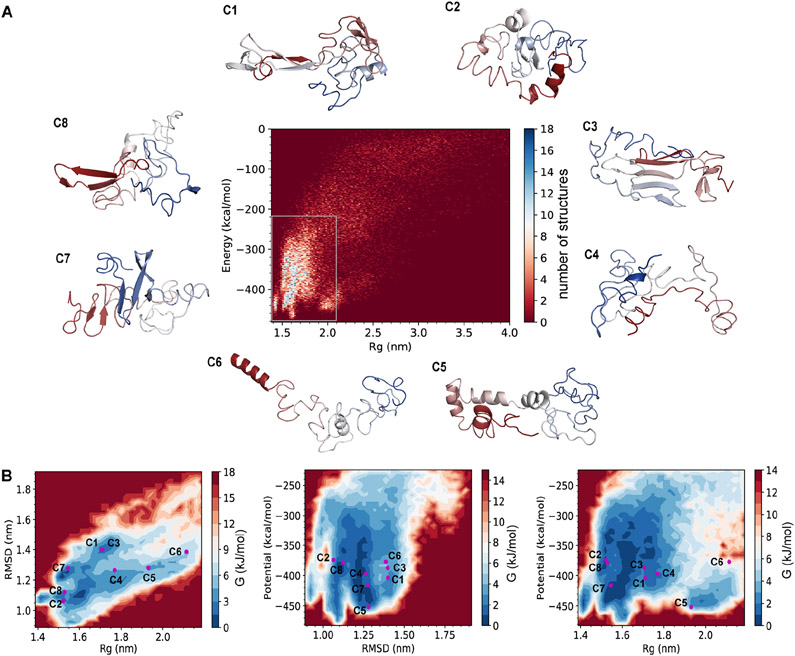
Figure 2. The eight distinct clusters resolved by trFRET-DMD.
(A) Energy versus radius of gyration (Rg) for the structural ensemble and the centroid structures of the eight clusters (C1-8). The structures are colored from red (N-terminus) to blue (C-terminus).
(B) The energy landscapes of α-syn based on RMSD, Rg, and/or potential. RMSD indicates the distance between each structure and the average structure of the conformational ensemble.

