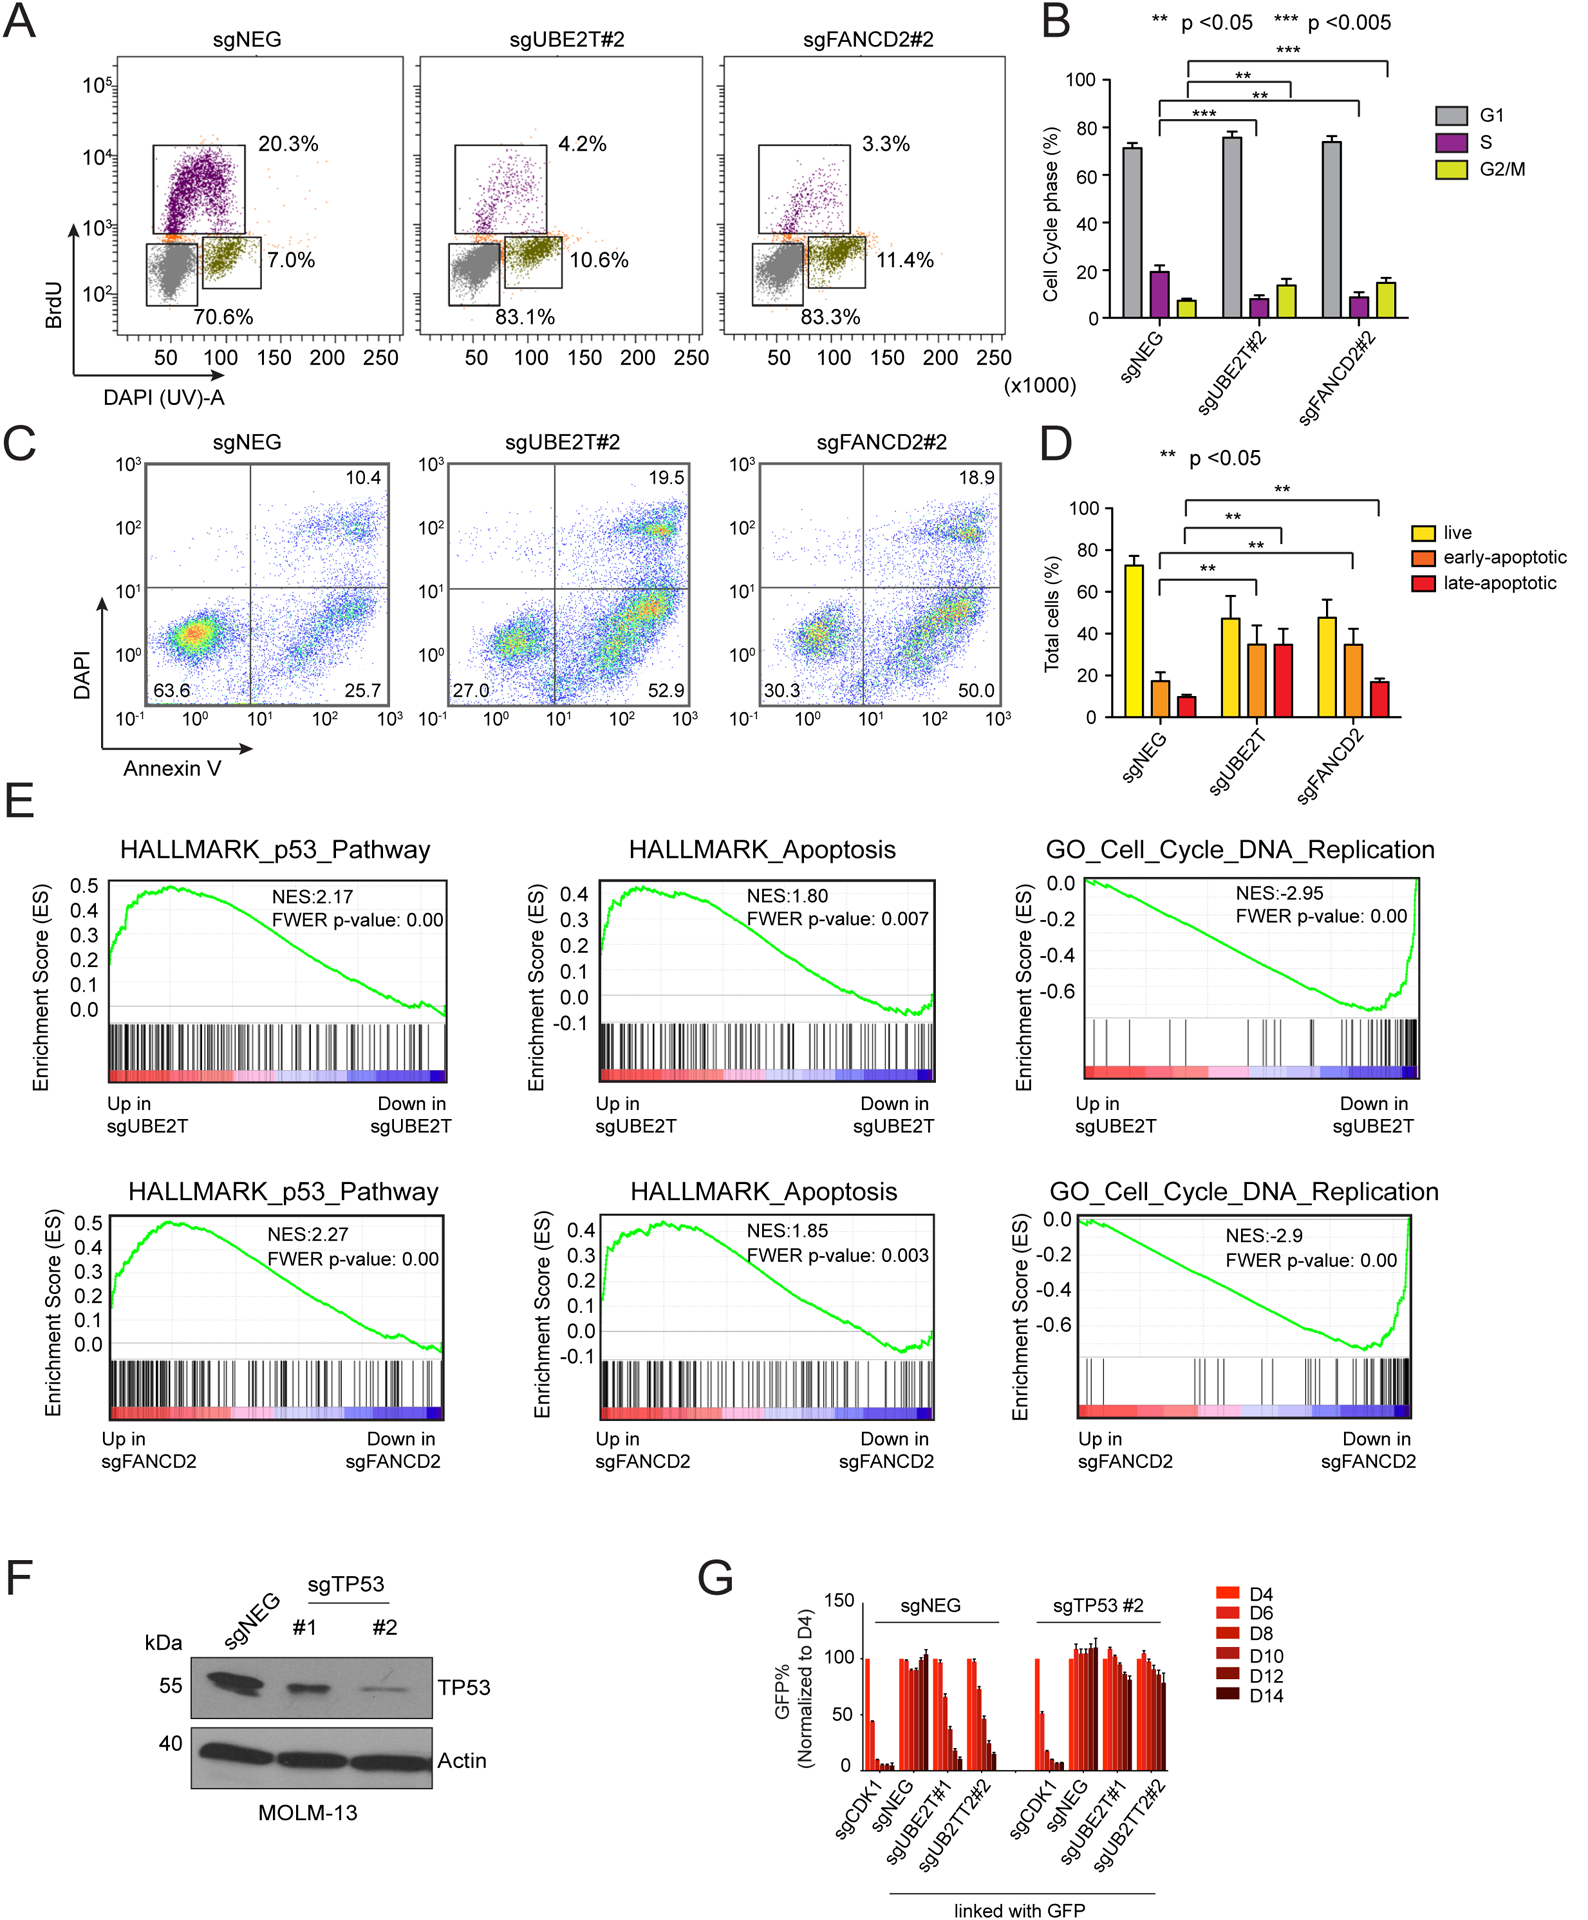
Figure 3. Inactivation of Fanconi anemia genes in AML leads to p53-induced cell cycle arrest and apoptosis.

(A) Representative flow cytometry analysis of BrdU incorporation and DNA content to infer cell status following lentiviral transduction of MOLM-13 cells with the indicated sgRNAs (day 6). (B) Quantification of different cell cycle stages, average of 3 biological replicates. Paired Student’s t-test was applied to calculate p values. (C) Representative flow cytometry analysis of DAPI (indicating permeable dead cells) and annexin-V staining (a pre-apoptotic cell marker) following lentiviral transduction of MOLM-13 cells (day 6). (D) Quantification of live and apoptotic cells, average of 3 biological replicates. Paired Student’s t-test was applied to calculate p values. (E) Gene set enrichment analysis (GSEA) of RNA-seq data obtained from MOLM-13 cells lentivirally transduced with the indicated sgRNAs (70). Normalized enrichment score (NES) and family-wise error rate (FWER) p-value are shown. (F) Western blot analysis performed on lysates obtained from MOLM-13 cells on day 6 following sgRNA transduction. (G) Competition-based proliferation assays in MOLM-13 cells following sequential sgRNA transduction. Negative sgRNA or TP53 sgRNAs were infected first, selected with neomycin, followed by transduction with the sgRNAs indicated at the bottom of the graph (linked with GFP). n=3. All bar graphs represent the mean ± SEM. All sgRNA experiments were performed in Cas9-expressing cell lines.
