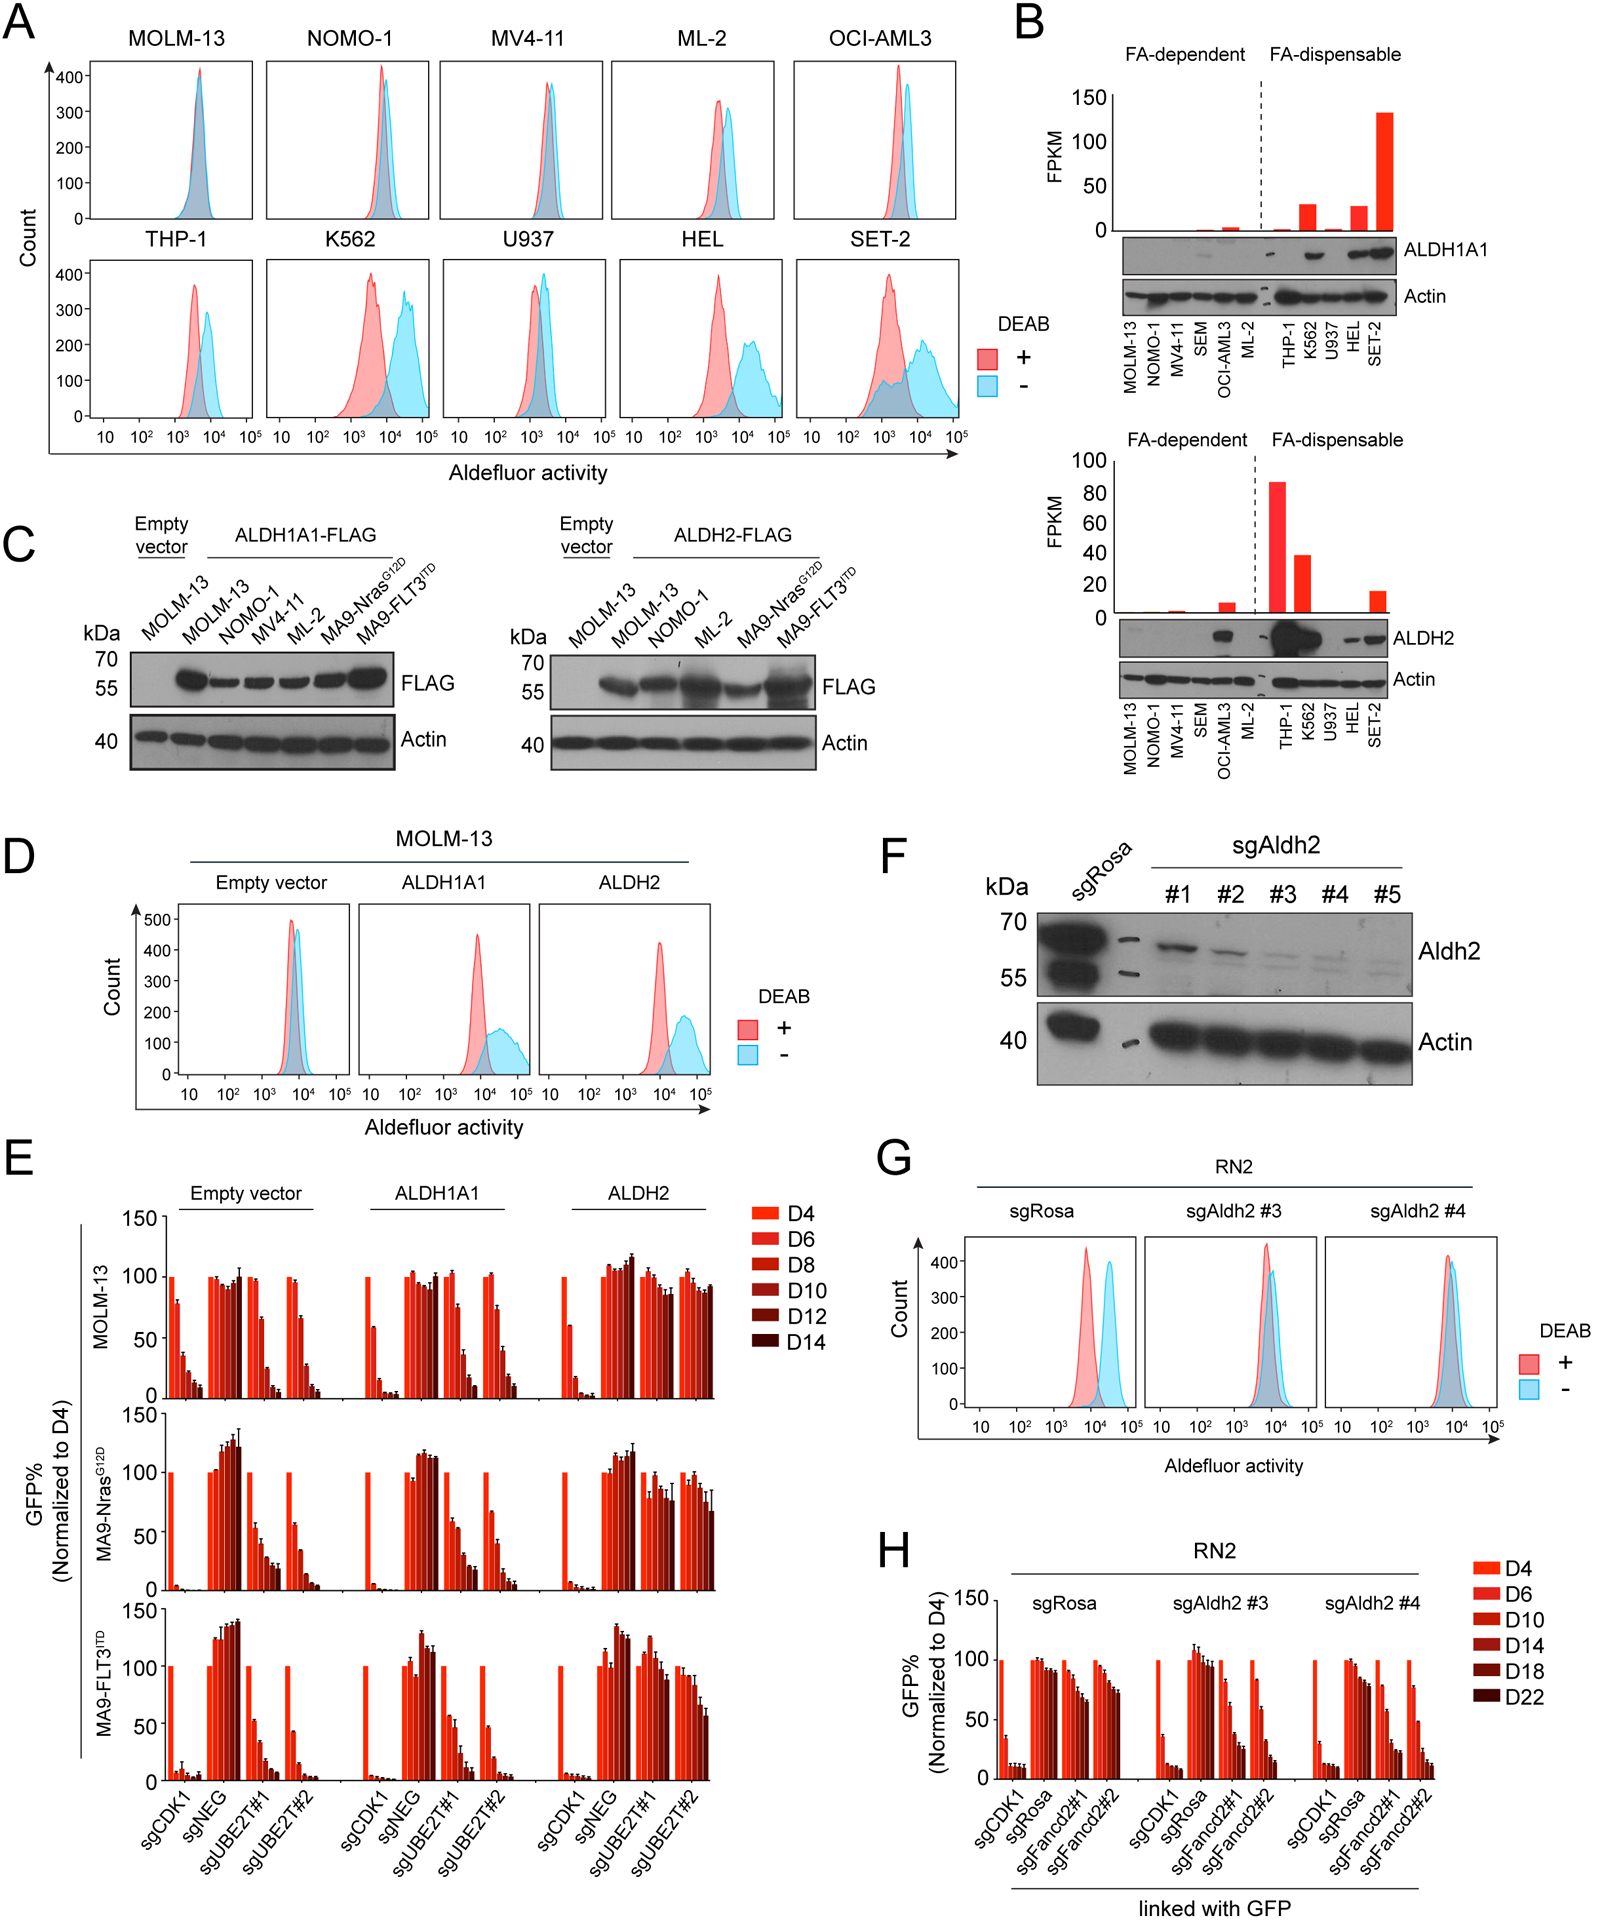
Figure 4. Silencing of ALDH2 expression in AML confers Fanconi anemia protein dependency.

(A) Representative flow cytometry analysis of Aldefluor assays, in which AML cell lines were treated with 3.75 μM BAAA, with or without the ALDH inhibitor DEAB (15 μM). (B) RNA and protein levels of ALDH1A1 or ALDH2 measured by RNA-seq (top) and western blot (bottom) in the indicated cell lines. (C) Western blot analysis of whole cell lysates from cell lines transduced with the indicated lentiviral cDNA constructs. (D) Representative Aldefluor analysis of MOLM-13 cells expressing FLAG-tagged ALDH1A1 or ALDH2. (E) Competition-based proliferation assay in MOLM-13 expressing the indicated cDNAs, followed by transduction with GFP-linked sgRNA. (F) Western blot analysis of ALDH2 expression in RN2 cells following lentiviral transduction with the indicated sgRNAs. (G) Aldefluor assay performed in RN2 cells following lentiviral transduction with the indicated sgRNAs. (H) Competition-based proliferation assays performed in RN2 cells (control vs Aldh2 knockout) with the indicated sgRNAs linked to GFP. All bar graphs represent the mean ± SEM, (n=3). All sgRNA experiments were performed in Cas9-expressing cell lines.
