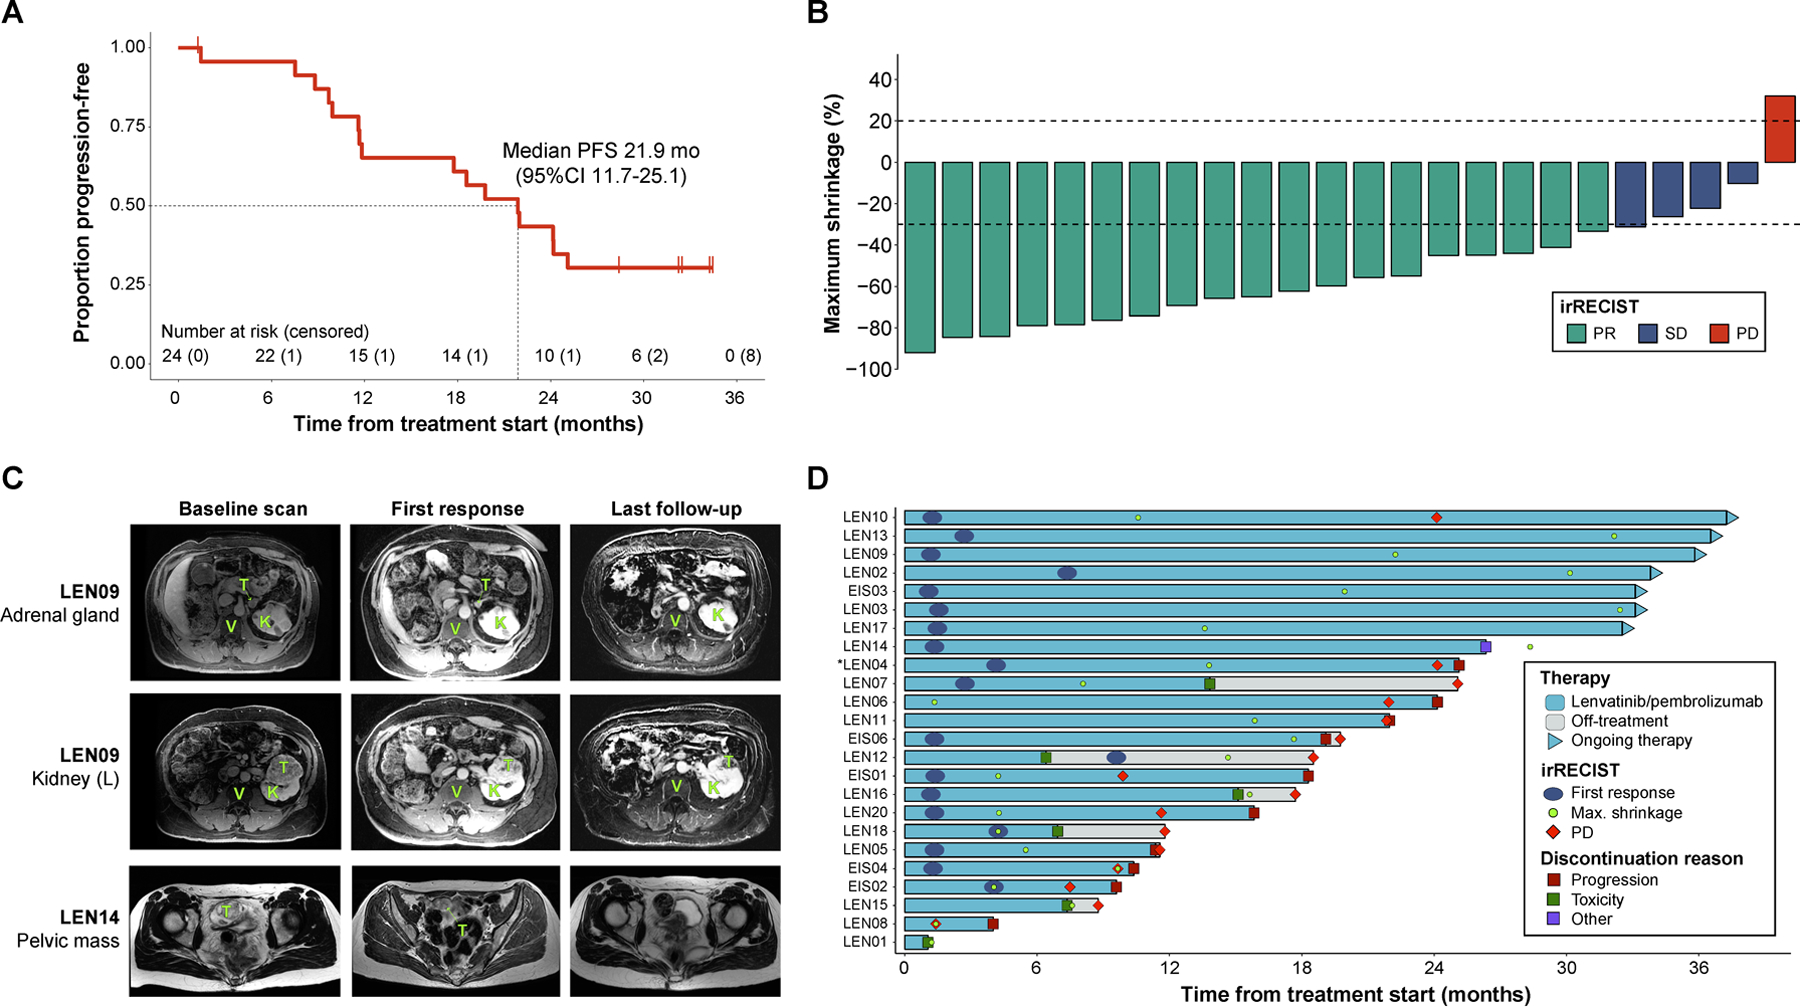
Fig. 1. Clinical outcomes of the lenvatinib/pembrolizumab cohort.

(a) Kaplan-Meier curve showing the progression-free survival estimates of the 24 patients included in the study. Median survival along with its 95% confidence interval are reported. (b) Maximum tumor shrinkage (in percentage) in the target lesions measured as part of patient assessment. Tumor responses were evaluated using irRECIST. (c) Magnetic resonance imaging (MRI) studies performed during patient management to assess therapy response. The representative images are from patients that showed exceptional responses to the combination regimen. Legend: T: tumor, K: normal kidney, V: vertebral body. (d) Swimmer plot showing the sequence of therapy-related events during patient management. Bars represent the timeline of each individual from therapy start to disease progression, treatment discontinuation or last-follow-up, whichever occurred later. Patients still on therapy are represented by the triangles at the end of the bars.
