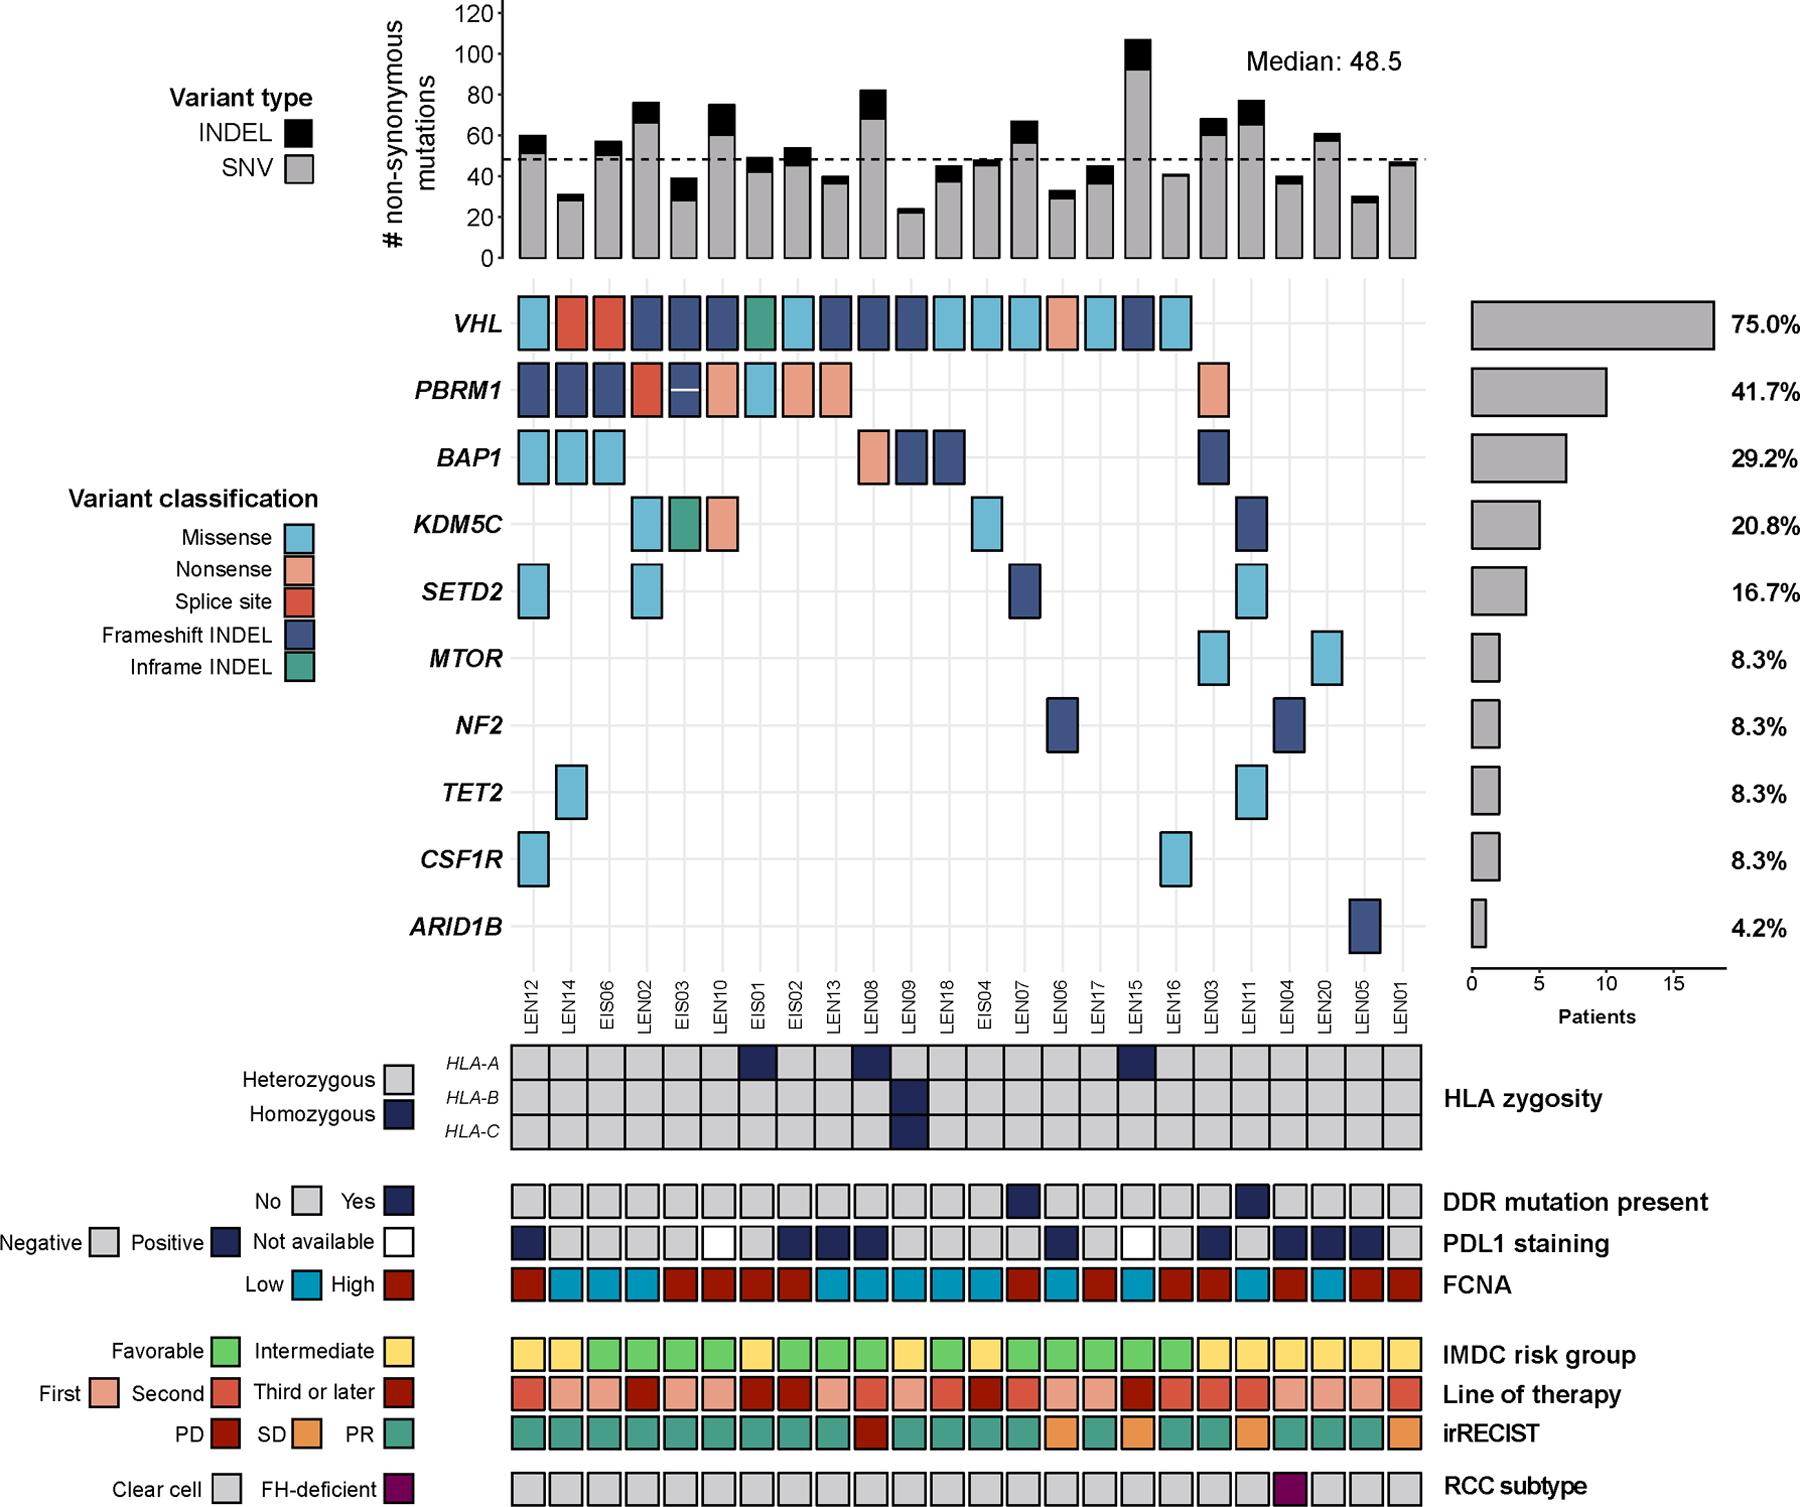
Fig. 2. Genomic characterization of the study cohort.

The oncoprint shows the most common nonsynonymous somatic mutations in cancer-associated genes identified by exome-sequencing. The top bars represent the number of variants identified in each sample, while the side bars represent the number (and percent) of individuals displaying mutations in each gene. The bottom tiles contain additional genomic and clinical information evaluated as part of this study.
