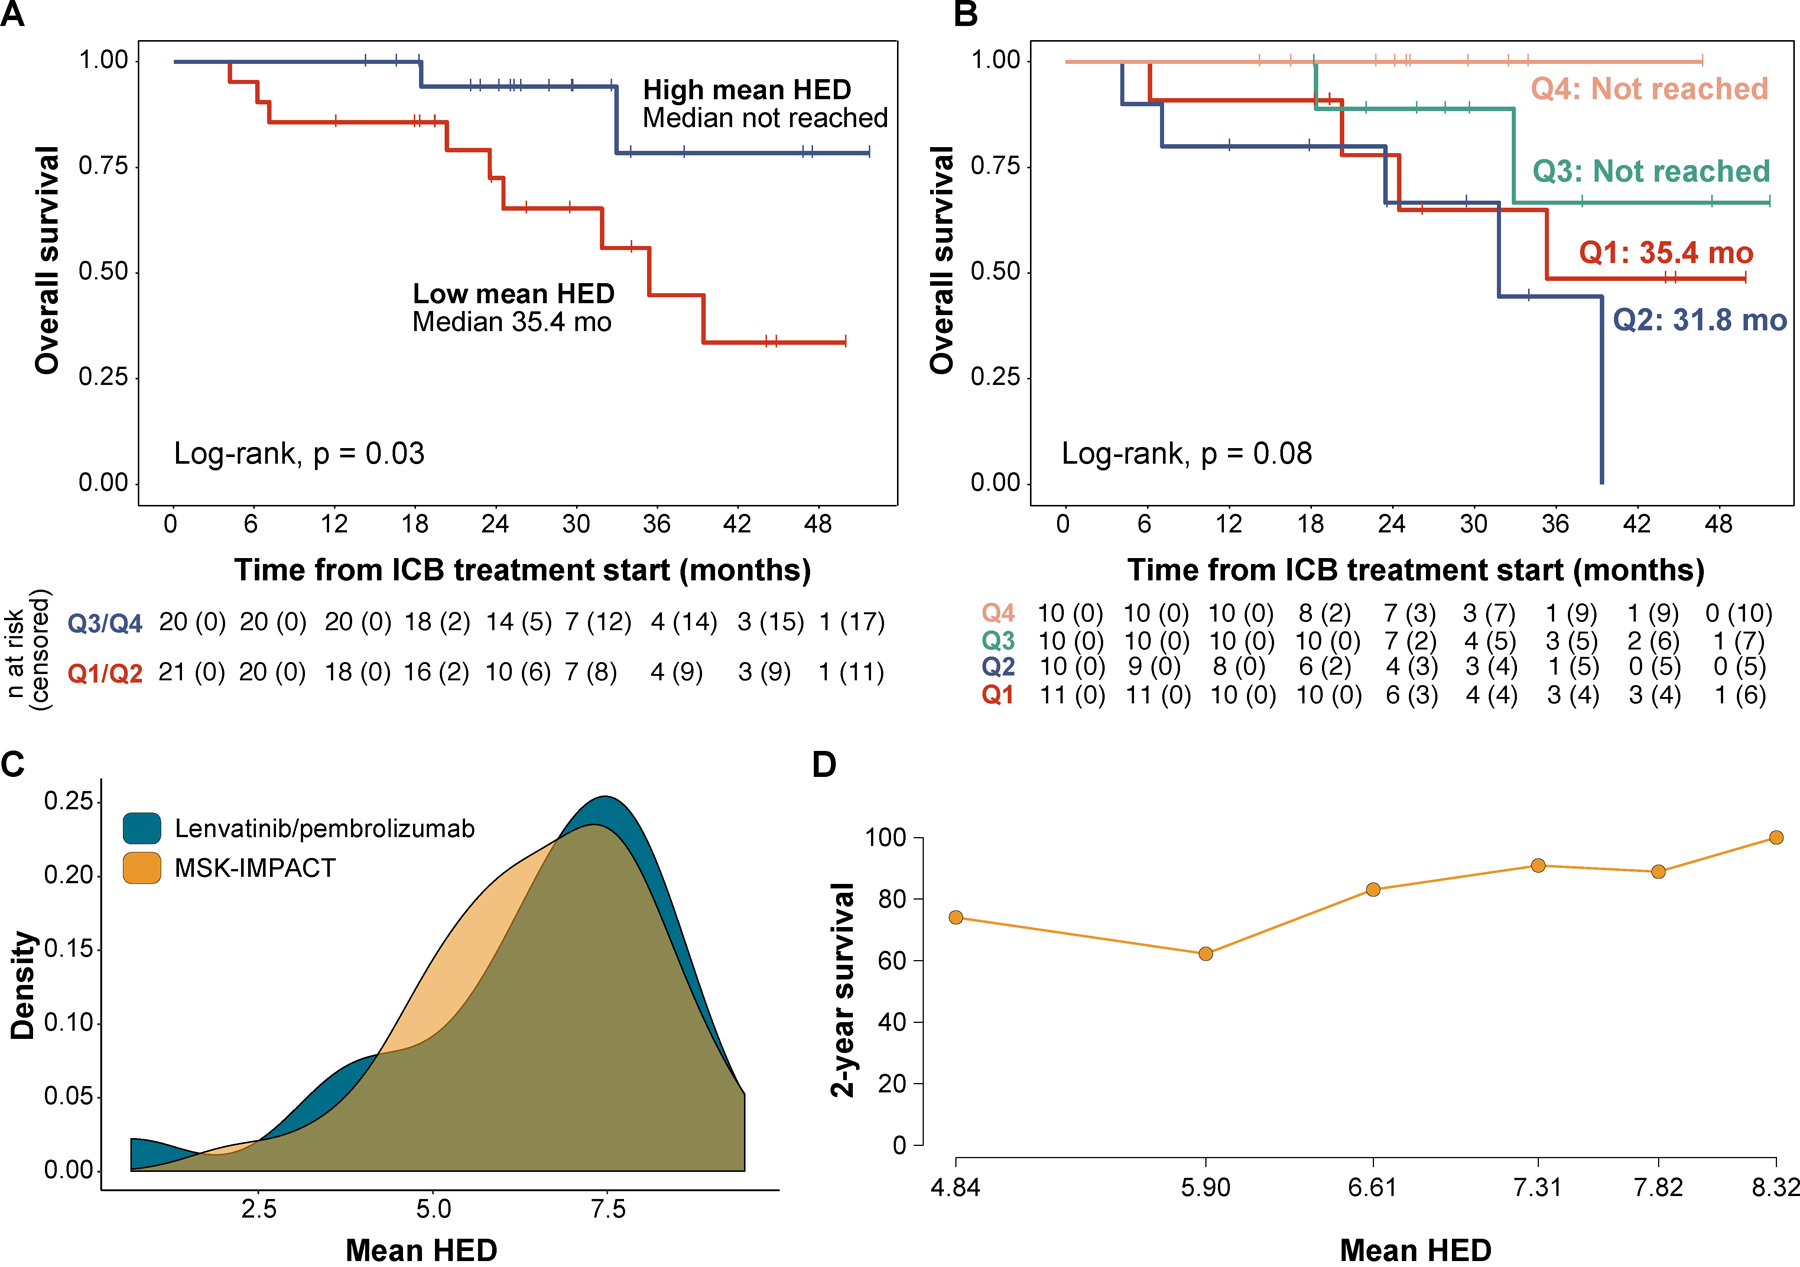
Fig. 5. Validation of results in the MSK-IMPACT cohort.

(a) Kaplan-Meier curve showing the overall survival (OS) estimates, stratifying patients by the median value of mean HED. (b) Kaplan-Meier curve showing OS estimates stratifying patients by mean HED quartiles. (c) Density plots showing the distribution of mean HED values in the discovery (lenvatinib/pembrolizumab, n=24) and validation cohorts (MSK-IMPACT, n=41). (d) Subpopulation treatment effect pattern plot (STEPP) showing the 2-year survival probability across the mean HED range, higher divergence was found to be associated with improved outcomes.
