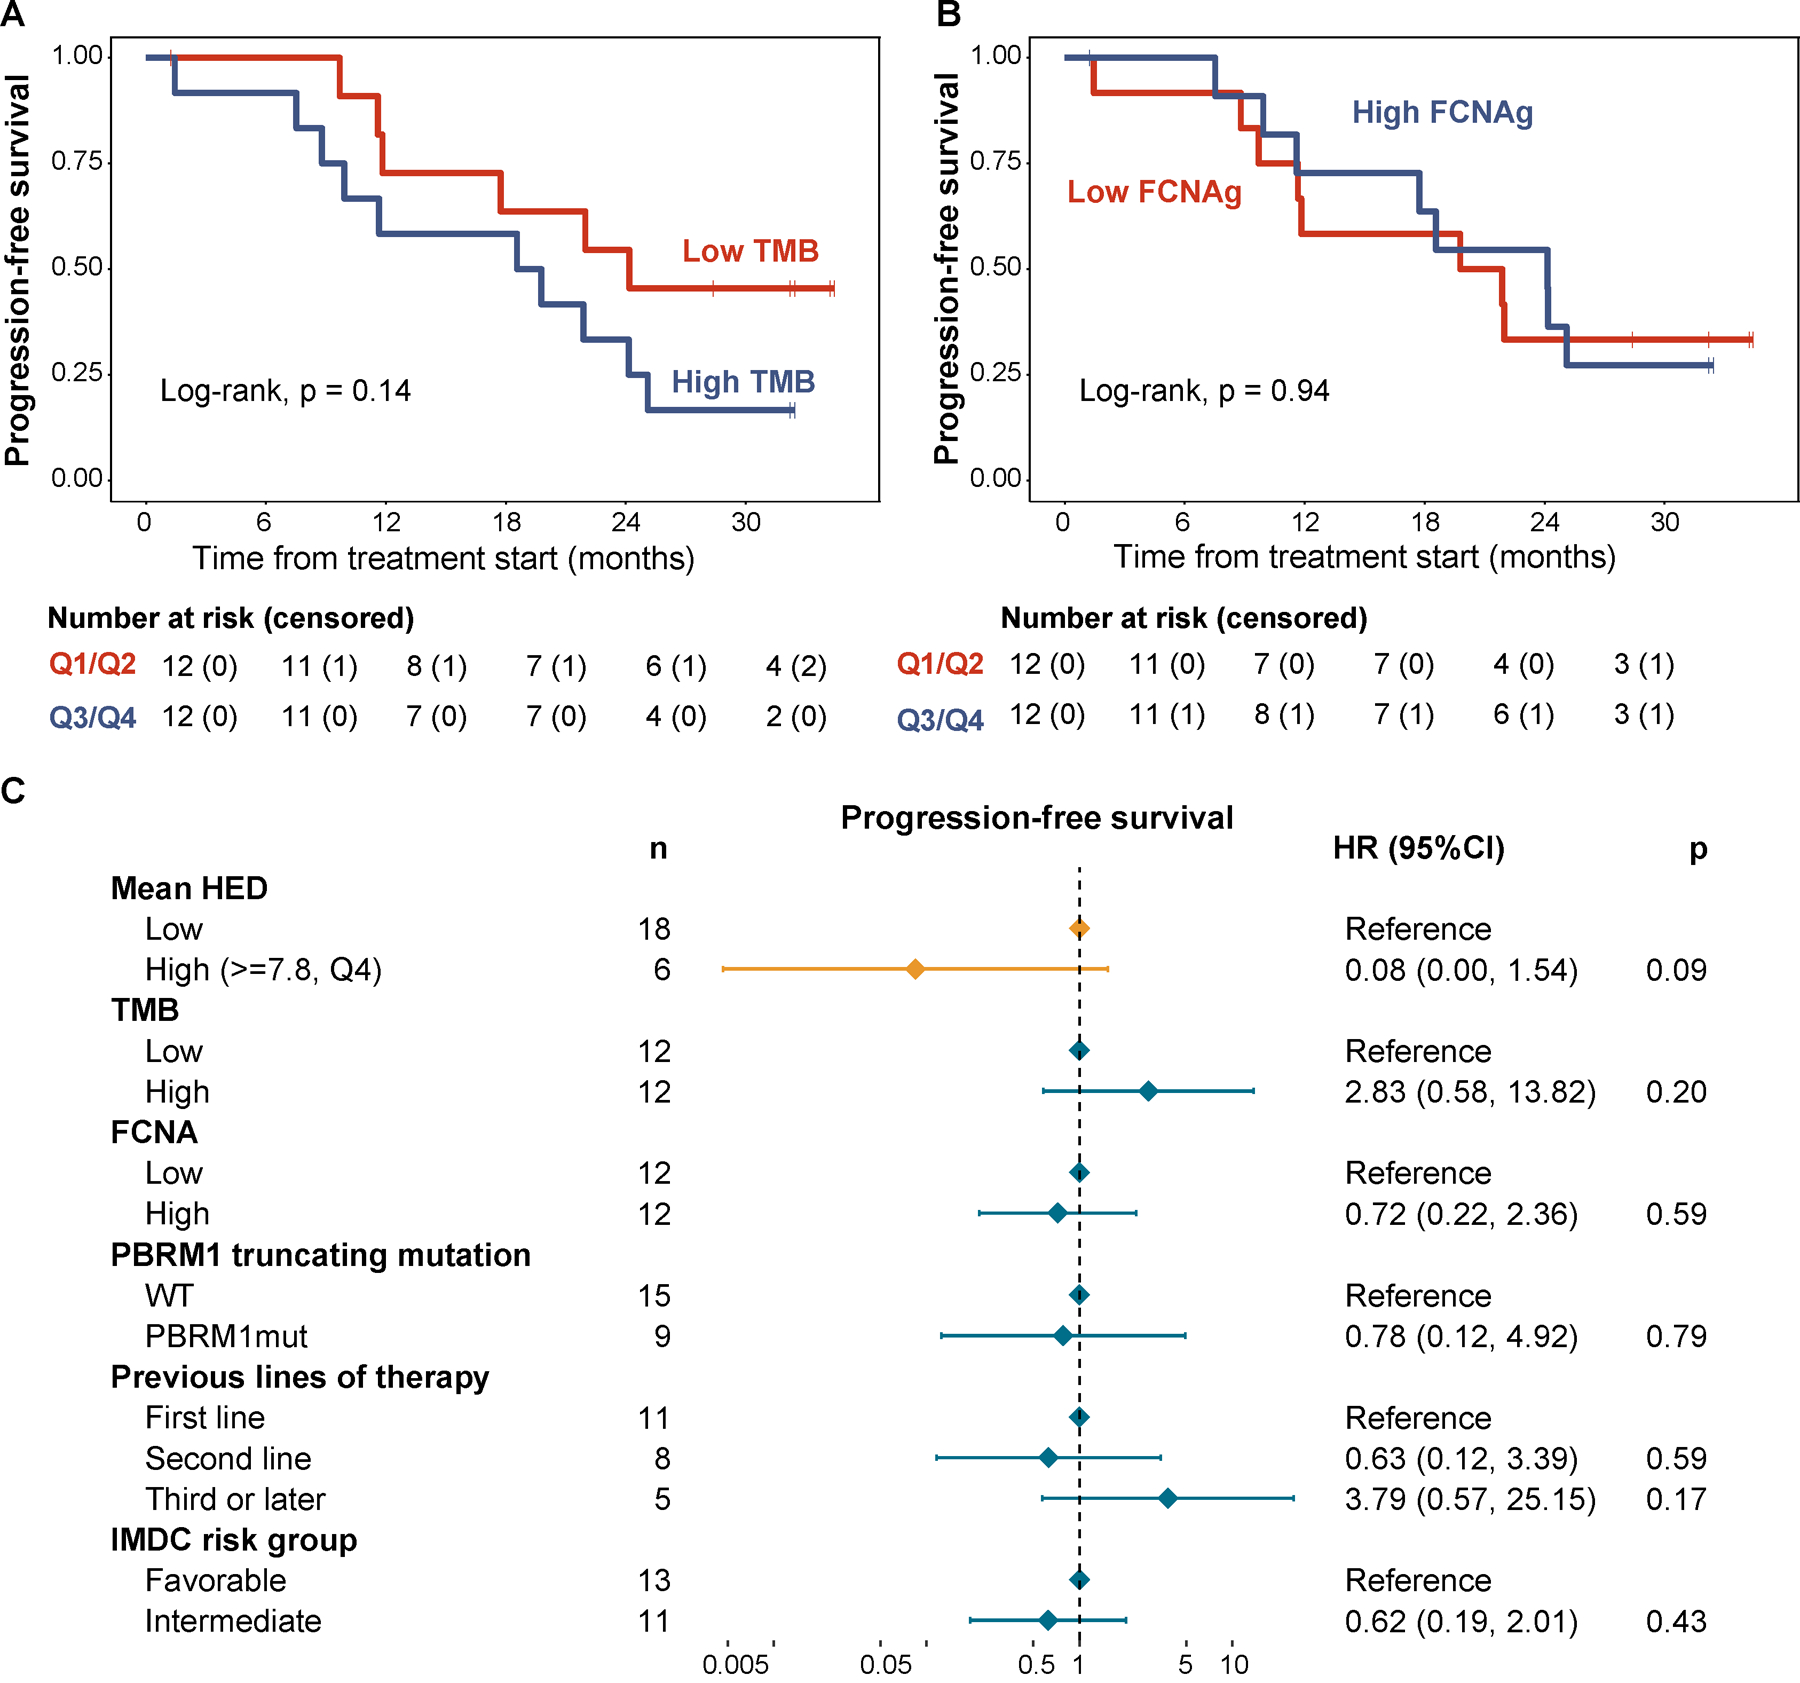
Fig. 6. Other potential biomarkers of response to ICB therapy and their association with progression-free survival in RCC.

(a) Kaplan-Meier curve showing PFS by tumor mutational burden (stratified by the median). (b) Kaplan-Meier curve showing PFS by the fraction of non-diploid genome (stratified by the median). (c) Forest plot showing the results from a multivariable Cox regression model including genomic biomarkers of response to ICB tested in the study as well as additional relevant prognostic factors.
