. 2021 May 21;19(9):1559–1570. doi: 10.1158/1541-7786.MCR-20-1017

Figure 2.

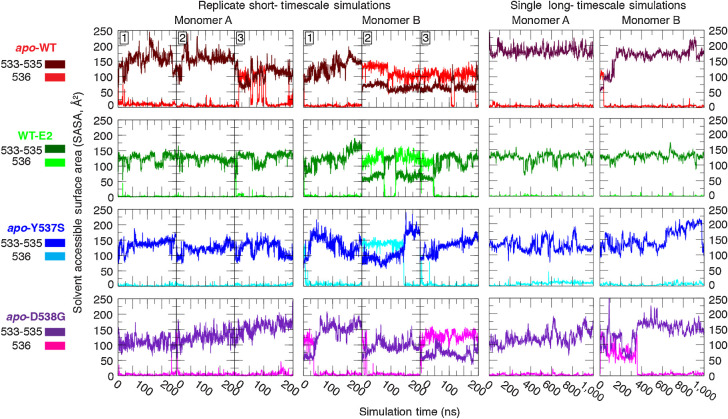
Figure 2. Solvent exposure of consecutive hydrophobic residues in the H11–12 loop. The solvent accessible surface area (SASA) was measured for residues 533–535 (Val, Val, Pro, dark coloring) and for 536 (Leu, light coloring), separately, in replicate 200-ns (left 2) and in single 1-μs (right 2) equilibrium simulations.

Solvent exposure of consecutive hydrophobic residues in the H11–12 loop. The solvent accessible surface area (SASA) was measured for residues 533–535 (Val, Val, Pro, dark coloring) and for 536 (Leu, light coloring), separately, in replicate 200-ns (left 2) and in single 1-μs (right 2) equilibrium simulations.