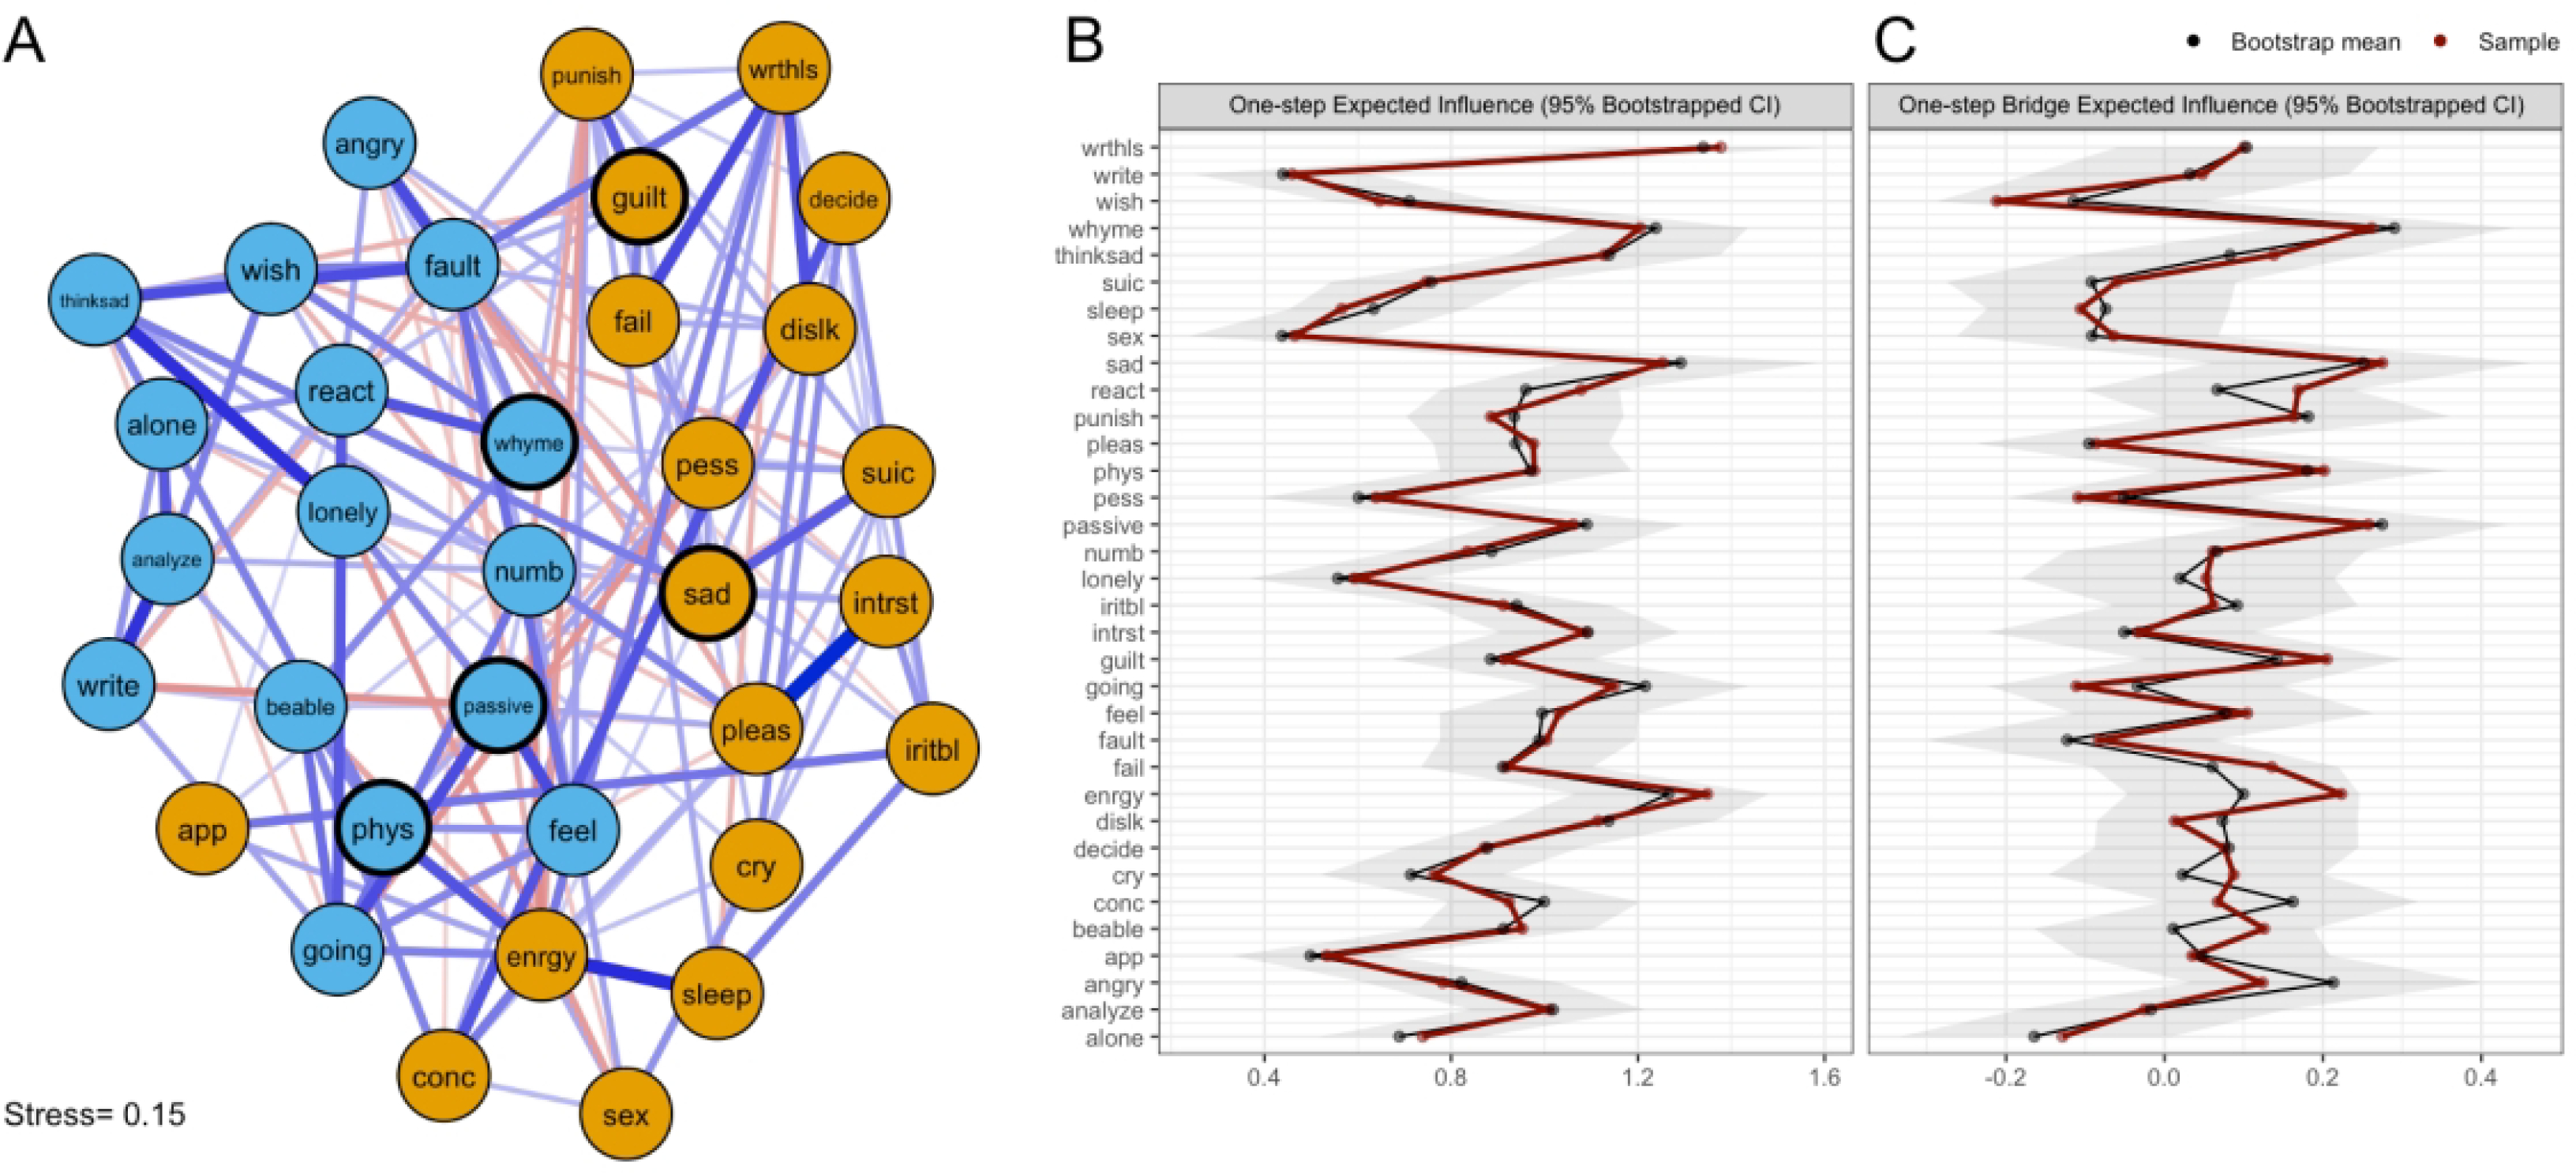
Figure 2. Network of Ruminative Responses Scale (RRS) and Beck Depression Inventory–II Items and Expected Influence Metrics.

Note.(A) Network graph arranged using multidimensional scaling. Edge thickness reflects partial correlation strength (thickest edge, rp=0.362), with blue lines representing positive correlations and red lines representing negative correlations. The proximity of two nodes is proportional to their degree of association with one another. Nodes derived from the RRS are presented in blue, while nodes derived from the BDI-II are presented in orange. Item content for each node is presented in Table 2. (B) Raw one-step expected influence values for each node, along with 95% bootstrapped confidence intervals. (C) Raw one-step bridge expected influence values for each node, along with 95% bootstrapped confidence intervals.
