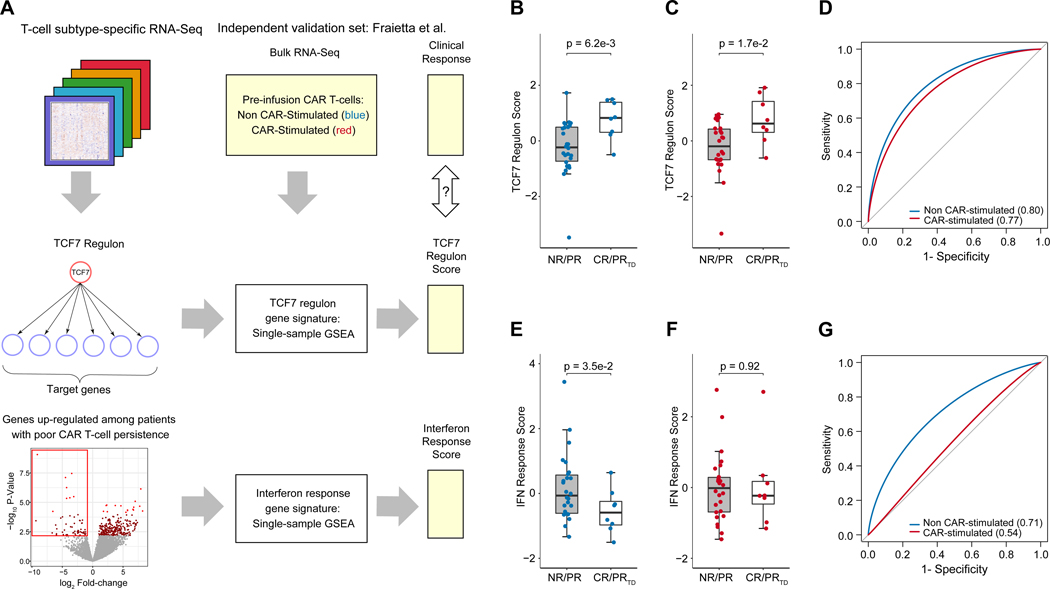
Figure 5. Validation of TCF7 regulon and interferon response gene signature in an independent dataset.
(A) Workflow for development and validation of gene signatures representing the TCF7 regulon and interferon response pathways acting between and within T-cell subsets. (B-C) Evaluation of the TCF7 regulon score on the independent dataset of Fraietta et al. on both the unstimulated (blue) and CAR-stimulated (red) CAR T-cells from patients with chronic lymphoblastic leukemia (CLL). Each point represents a patient. Clinical response groups were as previously described in the independent validation set5, with unfavorable outcomes, NR = non-responder, PR = partial responder; and favorable outcomes PRTD = partial responder with highly active T-cell products, CR = complete remission. Statistical significance between clinical response groups was assessed with Welch’s t-test. (D) Receiver operating characteristic curve for the TCF7 regulon score. (E-F) Evaluation of the interferon response score on the independent dataset of Fraietta et al. on both the unstimulated (blue) and CAR-stimulated (red) CAR T-cells. Statistical significance was assessed with Welch’s t-test. (G) Receiver operating characteristic curve for the interferon response score.

