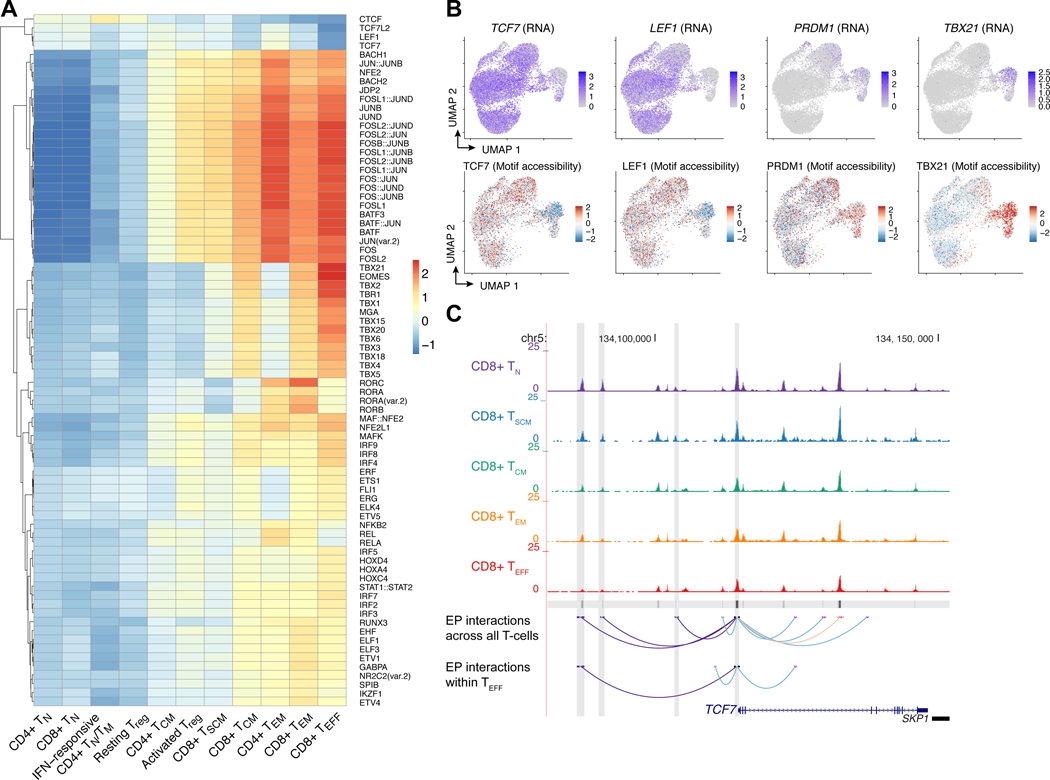
Figure 7. Single-cell ATAC-Seq captures the epigenetic regulation of T-cell functional states and reveals that transcriptional regulation of TCF7 is partially maintained in CD8+ TEFF.
(A) Heatmap of chromVAR deviation scores associated with TF motifs across T-cell clusters. Shown are motifs that were significantly associated with T-cell cluster (ANOVA FDR < 0.05) and for which at least one T-cell subtype had an absolute deviation score greater than 0.90. (B) Normalized RNA expression of TCF7, LEF1, PRDM1, and TBX21, and associated chromVAR motif deviation scores. (C) Chromatin accessibility tracks for CD8+ TN, TSCM, TCM, TEM, and TEFF at the TCF7 locus. The bottom tracks show high-confidence enhancer-promoter (EP) interactions predicted based on chromatin co-accessibility (Cicero score > 0.25, light red), metacell-based regression (Bonferroni-adjusted p < 0.05, light blue), and EP interactions that were concordantly predicted with both methods (dark purple). EP interactions were predicted across all T-cells using the complete scATAC-Seq and CITE-Seq datasets, as well as on only the CD8+ TEFF cells.

