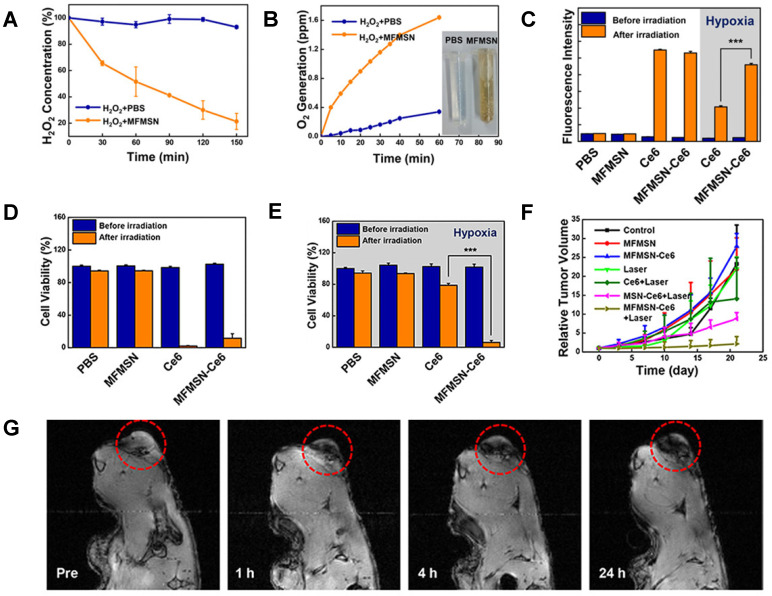
Figure 15.
A. Degradation of H2O2 (n = 3) and B O2 generation after treatment with MFMSNs in PBS. C. Generation of singlet oxygen measured by the fluorescence intensity of SOSG (n = 3). D. Cell viability assay of MFMSN-treated U-87MG cells in normoxic environments. E. Cell viability assay of MFMSN-treated U-87MG cells in hypoxic environments. F. Tumour volume changes after treatment of U-87MG tumour-bearing mice. G. In vivo T2*-weighted MR images of a tumour-bearing mouse at various time periods, at 9.4 T. Tumours are circled with red dashed lines. Adapted with permission from 172, copyright 2017 American Chemical Society.

