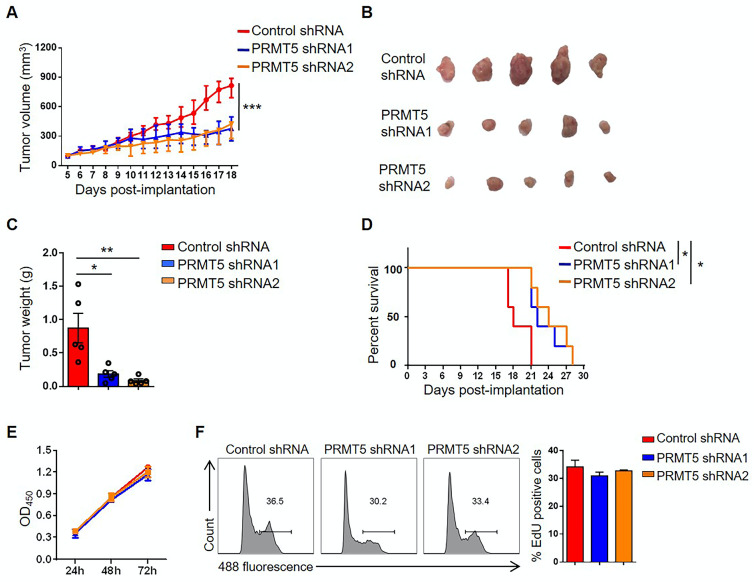
Figure 2.
Downregulation of PRMT5 inhibited tumor growth. (A-C) Control cells and PRMT5 knockdown U14 cells were subcutaneously injected into 6-week-old female C57BL/6 mice (n = 5 for each group). (A) A line graph shows the tumor growth curve of mice. Images (B) and weight (C) of the resected tumor at day 18 after inoculation. Data are representative of at least two independent experiments. Values are presented as the mean ± SEM. (D) Survival curve of tumor-bearing mice subcutaneously injected with control cells and PRMT5 knockdown U14 cells (n = 5 for each group) (log-rank test). (E-F) Proliferation of control cells and PRMT5 knockdown U14 cells were analyzed by CCK-8 assay (E) and EdU staining (F). Data are representative of at least two independent experiments. Values are presented as the mean ± SEM. *P < 0.05, **P < 0.01, and ***P < 0.001.

