Figure 3.
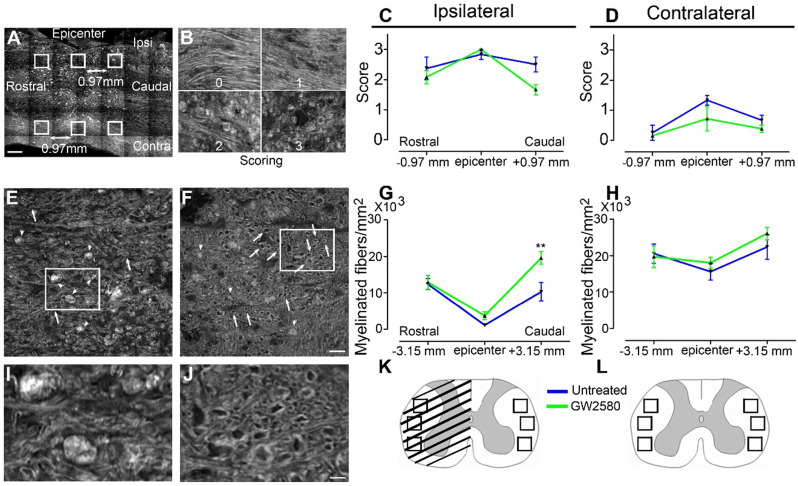
Transient CSF1R blockade after SCI in mice modifies outcomes on myelinated fibers. Sagittal CARS low resolution mosaic of a mouse spinal cord to indicate locations of the 6 images acquired per mouse (white boxes) used to score myelin morphology (A). Myelin scorings (B), normal white matter is associated with the score zero; scores 1 and 2 reflect an increasing occurrence of lipid debris and disorganized axonal arrangement and score 3 represents a complete loss of axonal alignment and major lipid debris. Myelin morphology scores quantified 6 weeks after SCI on sagittal sections of the spinal cord ipsilateral (C) and contralateral (D) to the lesion site. Representative CARS axial imaging of myelin after SCI in untreated (E & I) and GW2580-treated (F & J) mice. Quantification on axial sections of myelinated fibers/mm2 ipsilateral (G) and contralateral (H) to the lesion site 6 weeks after a lateral hemisection of the spinal cord in untreated and treated groups. Schematic spinal cord, boxes indicate locations of the 6 images acquired per mouse to quantify myelinated fibers density at the epicenter (K) and rostral and caudal to the lesion (L). In all graphs, results obtained by untreated mice are in blue and GW2580-treated mice in green. Scale bars: 500 µm (A); 20 µm (B); 20 µm (E-F), and 5 µm (I & J). Number of mice: n = 3 for untreated and treated groups for both axial and sagittal sections. Myelinated fibers: for each animal, 3 images per rostro-caudal location (-3.15 mm, epicenter and +3.15 mm) were quantified on both the ipsilateral and contralateral sides. Data are mean ± SEM per group. Student's unpaired t-test, *p < 0.05.

