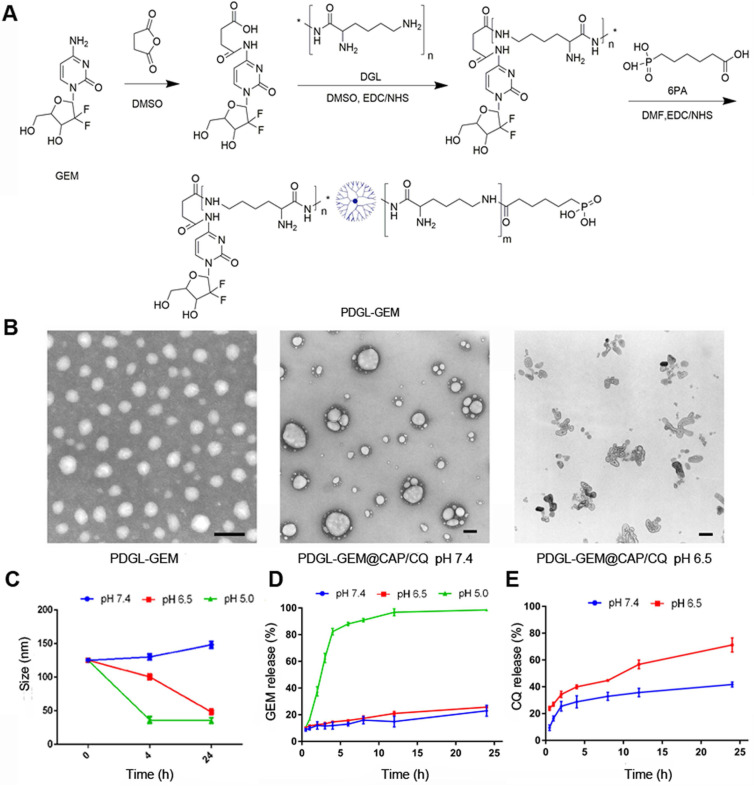
Figure 1.
(A) Schematic of PDGL-GEM synthesis. (B) Transmission electron micrographs of PDGL-GEM and of PDGL-GEM@CAP/CQ at pH 6.5 or 7.4. Scale bar: 100 nm. (C) Size of PDGL-GEM@CAP/CQ incubated at different pHs (n = 3, mean ± SD). (D) Release of GEM and CQ from PDGL-GEM@CAP/CQ at different pHs (n = 3, mean ± SD).

