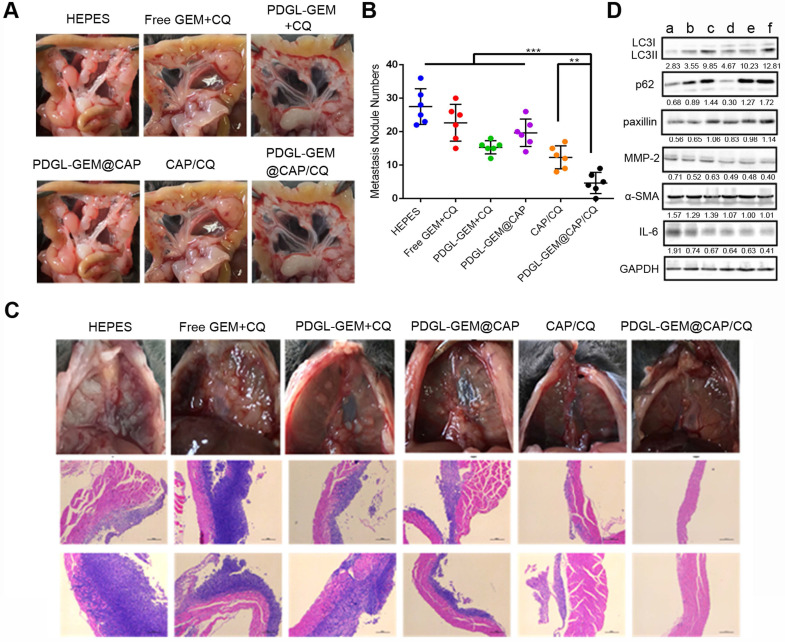
Figure 8.
(A) Photographs of mesentery of Pan 02 orthotopic tumor-bearing mice on day 18 after the first treatment. (B) Quantitative analysis of globular tumor nodules in the mesentery vessels and diaphragm (n = 6). **p < 0.01, ***p < 0.001. (C) Representative images and H&E staining of thoracic diaphragm of Pan 02 orthotopic tumor-bearing mice on day 18 after the first treatment. (D) Expression of LC3, p62, paxillin, MMP-2, ɑ-SMA, and IL-6 in orthotopic Pan 02 tumors, as detected by western blot. a: HEPES, b: Free GEM + CQ, c: PDGL-GEM + CQ, d: PDGL-GEM@CAP, e: CAP/CQ, f: PDGL-GEM@CAP/CQ. The numbers represent the gray values measured by image J and normalized to GAPDH. LC3 II was further normalized to LC3 I.

