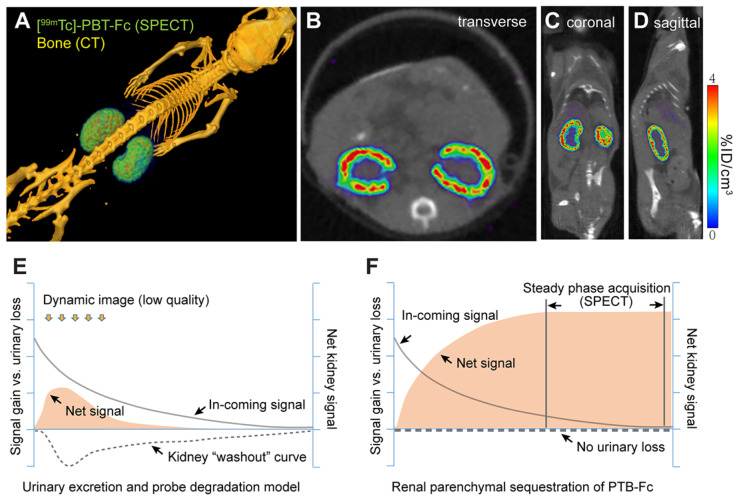
Figure 3.
The renal-targeting [99mTc]-PBT-Fc tracer facilitated steady phase signal acquisition for SPECT. A. Micro-SPECT/CT imaging of mouse, showing exclusive renal signals of [99mTc]-PBT-Fc in 3-dimentionalreconstruction. Heatmap scale in %ID/cm3. B-D. Sectional views of the radiotracer enriched in kidney cortex. E. A schematic model for concurrent tracer signal accumulation (solid curve), and loss, in the kidney of a conventional tracer that passes through the urinary route, either due to direct excretion or caused by tracer degradation (signal “washout”: dotted line). Consequently, the net renal signal (solid fill) stays at a low level. F. An illustrative model for PBT-Fc that enters (solid curve) the kidney cortex with no urinary loss (dotted line) results in a gradual accumulation of renal signals (solid fill). Once reached the steady phase of signal sequestration in the renal parenchyma, there is an extended window of time for SPECT image acquisition from collecting stable radionuclide signals for developing high quality images of the kidney.

