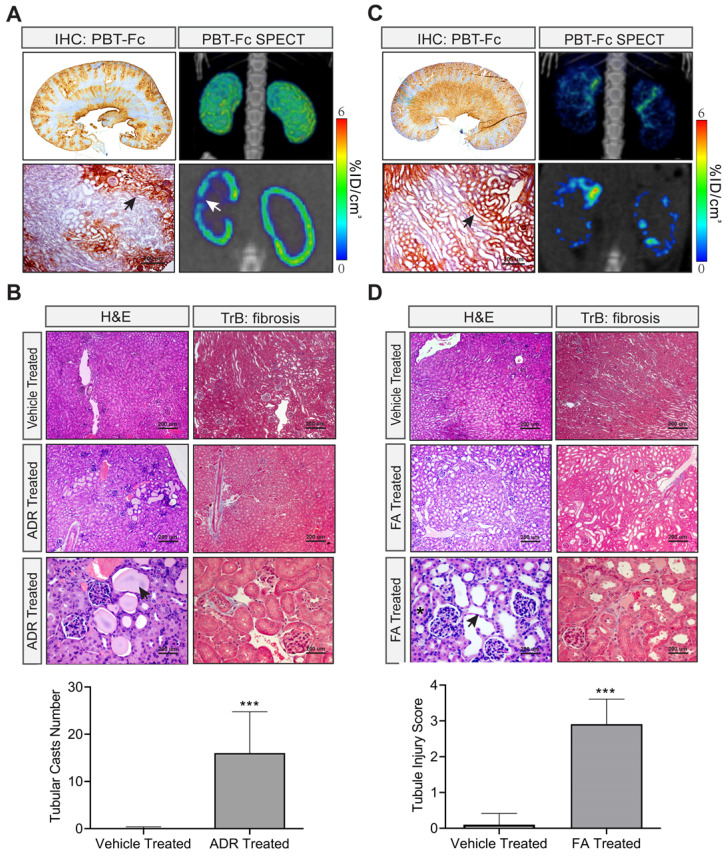
Figure 6.
Models of nephrotoxicity imaged by [99mTc]-PBT-Fc-direct SPECT. A. Systemic treatment with nephrotoxic drug Adriamycin in an AAN model showed relatively subtle alterations in PBT-Fc-directed SPECT (3D reconstructed view in top left panel). Areas of tracer signal loss was visible in the sectional view (arrow in bottom left panel). IHC detection of the probe (stained in brown) showed a zoned pattern of positive signal along the cortex to medulla directions (top middle showed whole kidney section and bottom middle showed a close-up area with an arrow pointing to preserved kidney functions with staining of the probe). Heatmap scale in %ID/cm3. B. H&E and Masson trichrome (TrB: fibrosis) staining of the kidneys following Adriamycin (ADR) treatment of the mice. Kidney lesions including tubular protein casts (arrow) were apparent, consistent with the nephrotic characteristics of the AAN model. Bottom panel: Tubular casts were semi-quantified from 10 randomly chosen images in each group (ADR vs. control). C. In contrast, the folic acid (FA) nephropathy model of renal tubular injury displayed a drastically altered SPECT pattern of the kidney (compared to normal kidney in Figure 3A). Both 3-D composite and sectional views (left top and left bottom respectively) showed probe signal distributed in a discontinuous pattern. IHC staining also reveal areas of loss-of-signal in the cortex (arrow points tubules with the incorporation of the probe). D. H&E and Masson trichrome (TrB: fibrosis) staining showed characteristic lesions from FA-induced tubular obstruction, including intra-tubular crystal formation (asterisk) and tubular dilation and thinning of the tubular epithelial layer (arrow). Tubular injury scoring of the lesions was quantified from 10 randomly chosen images: 0, none; 1, < 25%; 2, 25% - 50%; 3, 50% - 75%; and 4, > 75%. ***, p < 0.001 between FA- and vehicle-treated groups.

