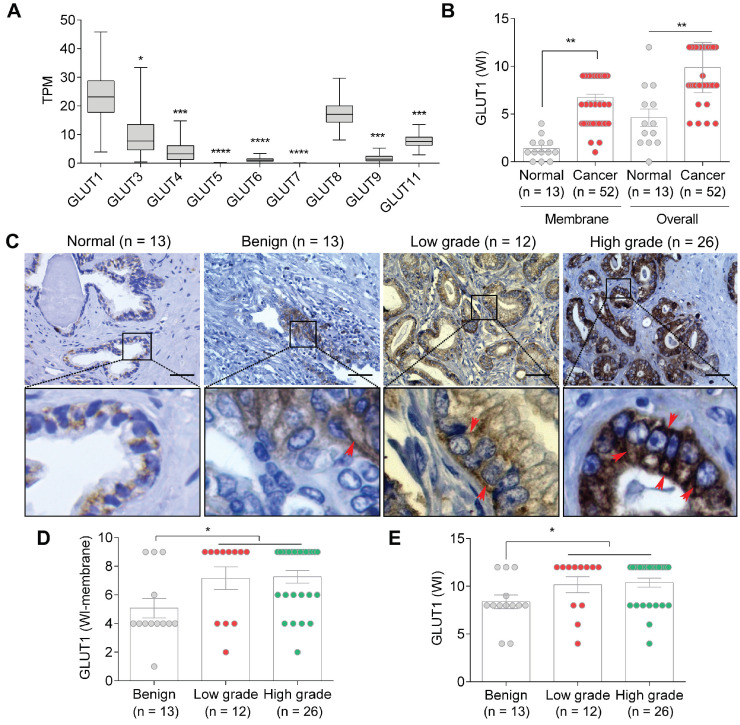
Figure 1.
GLUT1 expression in PCa. (A) GLUT1 expression levels are significantly higher than those of GLUT3-9 and 11 (n = 497). (B-C) Membrane and overall GLUT1 levels in normal vs. PCa tissues (B), and representative IHC images (C) in normal prostate, benign, low-grade, and high-grade PCa tissues; red arrows indicate membrane staining. (D-E) WI of membrane (D) and overall (E) GLUT1 levels in benign, low-grade, and high-grade PCa tissues. TPM: transcripts per million. Bars indicate mean ± SEM. Unpaired two-tailed Student's t-test with Welch's correction was used to determine the statistical significance (*P < 0.05, **P < 0.005, ***P < 0.0005). The scale bar represents 10 µm.

