Figure 2.
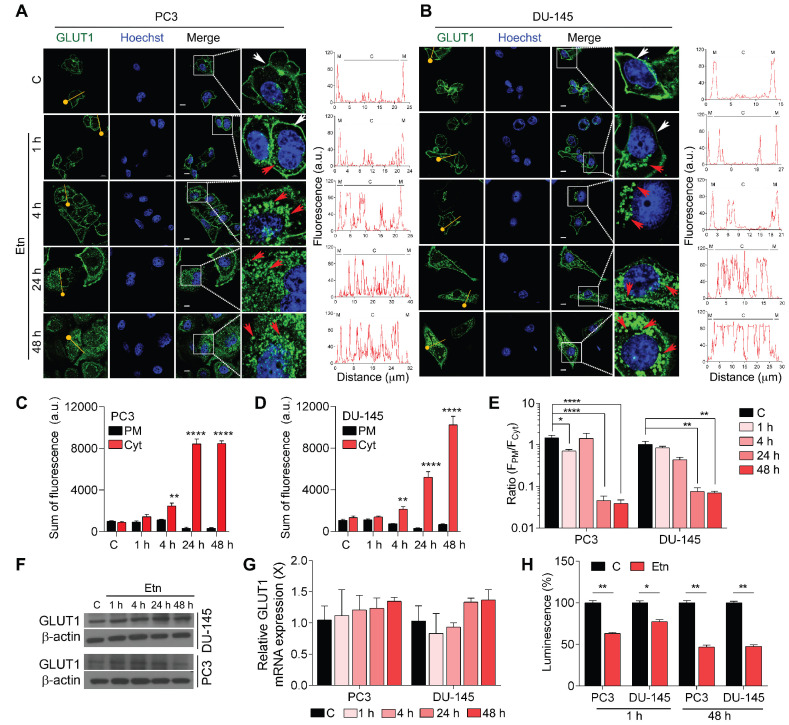
Altered GLUT1 localization in Etn-treated PCa cells. (A-B) Immunofluorescence staining assessing the changes in GLUT1 localization in Etn-treated PC3 (A, left) and DU-145 (B, left) cells at early and late time points. Fluorescence intensity measurements were recorded using plot profile analysis (A-B, right). The yellow line indicates the line plot profile function used for measuring the fluorescence intensity. White arrows indicate membrane GLUT1, whereas red arrows indicate cytoplasmic GLUT1. (C-D) Quantitative bar graphs showing the sum of membrane and cytoplasmic GLUT1 fluorescence intensities in PC3 (C) and DU-145 (D) cells. (E) Bar graphs indicating the ratio of GLUT1 fluorescence intensity (FPM/FCyt) in Etn-treated PCa cells. (F) Immunoblot showing GLUT1 levels in PCa cells treated with Etn for different time points. (G) GLUT1 mRNA levels in Etn-treated PCa cells. (H) Glucose uptake in PCa cells with and without Etn treatment at early and late time points. a.u: arbitrary units, X: fold change, PM: plasma membrane, Cyt: cytoplasm. Bars indicate mean ± SEM. Unpaired two-tailed Student's t-test with Welch's correction was used to determine the statistical significance (*P < 0.05, **P < 0.005, ***P < 0.0005). The scale bar represents 5 µm.

