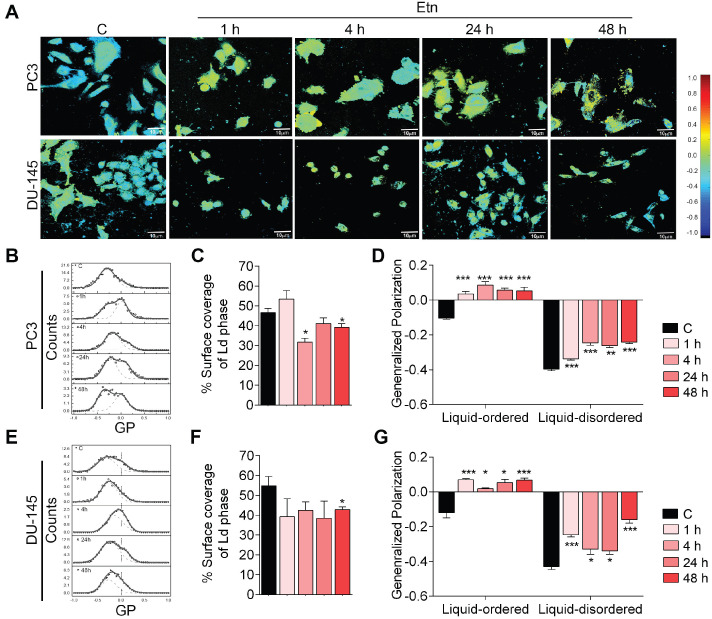
Figure 3.
Etn treatment decreases membrane fluidity in PCa cells. (A-B, E) Two-photon global GP images (n = 20) (A) and histograms (B, E) deconvoluted by fitting two-Gaussian distributions; the percentage of the surface coverage of Ld phase distribution was expressed as the area under the curve (B, E) of the two Gaussian distributions. (C, F) Bar graphs showing the percentage surface coverage of the Ld phase in PCa cells. (D, G) Bar graphs showing the liquid-ordered and liquid disordered phases in PCa cells treated with Etn for different time points. Bars indicate mean ± SEM. Unpaired two-tailed Student's t-test was used to determine the statistical significance (*P < 0.05, **P < 0.005, ***P < 0.0005). C = control. The scale bar represents 10 µm.

