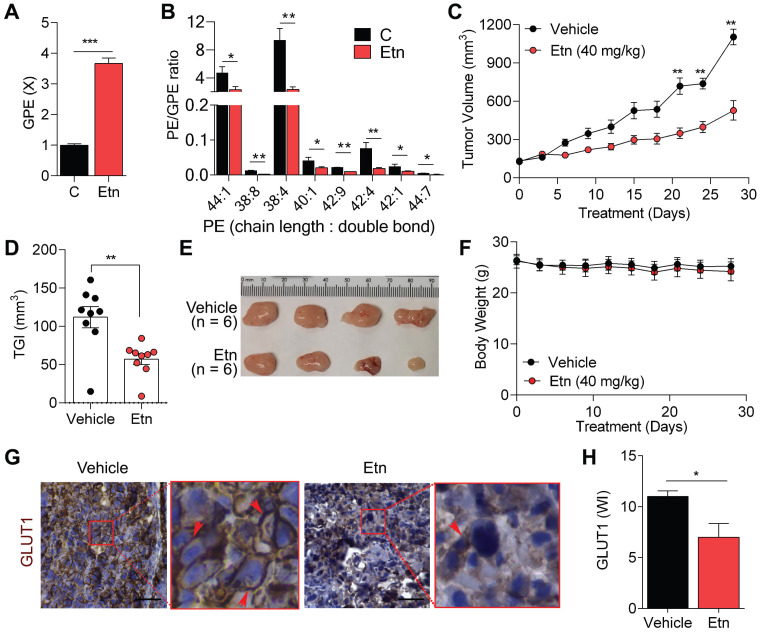
Figure 4.
Etn-induced PE/GPE ratio alterations inhibit tumor progression. (A) Bar graph showing the levels of GPE in control and Etn-treated PCa cells. (B) Quantification of PE and GPE levels using lipidomics and metabolomics analyses to assess the PE/GPE ratio in Etn-treated and untreated PCa cells. (C-F) Changes in tumor volume (C), tumor growth inhibition (D), and representative images (E) of PC3 xenografts, as well as body weights (F) of mice treated with vehicle and Etn for 28 days. (G-H) GLUT1 expression in PC3 xenografts of vehicle and Etn-treated mice; representative images (G) and quantification data (H) are shown. Red arrows indicate membrane staining. C = control (untreated PCa cells). Bars indicate mean ± SEM. Unpaired two-tailed Student's t-test with Welch's correction was performed to determine the statistical significance (*P < 0.05, **P < 0.005, ***P < 0.0005). The scale bar represents 10 µm.

