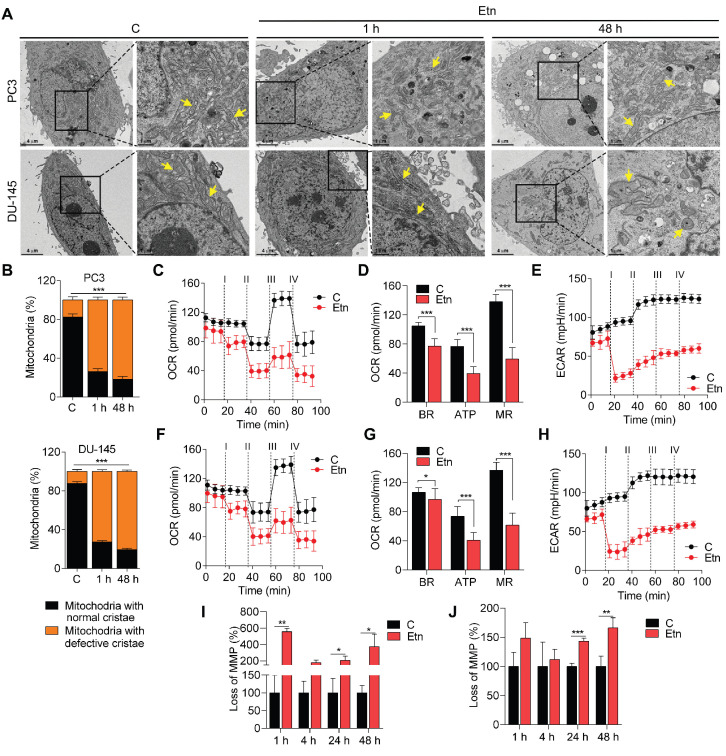
Figure 5.
Disrupted mitochondrial structure and function after Etn treatment. (A-B) Representative TEM images (A) and quantification (B) of the mitochondria in untreated and Etn-treated PCa cells. Yellow arrows indicate mitochondria. (C-F) Etn reduced OCR in PC3 (C) and DU-145 (F) cells; i-iv denotes treatment with Etn, oligomycin, FCCP, and rotenone/antimycin, respectively. (D-G) Bar graphs showing BR, ATP, and MR levels in control and Etn-treated PC3 (D) and DU-145 (G) cells. (E-H) Etn reduced ECAR in PC3 (E) and DU-145 (H) cells; i-iv denotes treatment with Etn, oligomycin, FCCP, and rotenone/antimycin, respectively. (I-J) Bar graphs showing the percentage of cells with loss of MMP in untreated and Etn-treated PC3 (I) and DU-145 (J) cells. C = control (untreated PCa cells). Bars indicate mean ± SEM. Unpaired two-tailed Student's t-test with Welch's correction was used to determine the statistical significance (*P < 0.05, **P < 0.005, ***P < 0.0005). Scale bars indicate 4 µm and 1 µm.

