Figure 3.
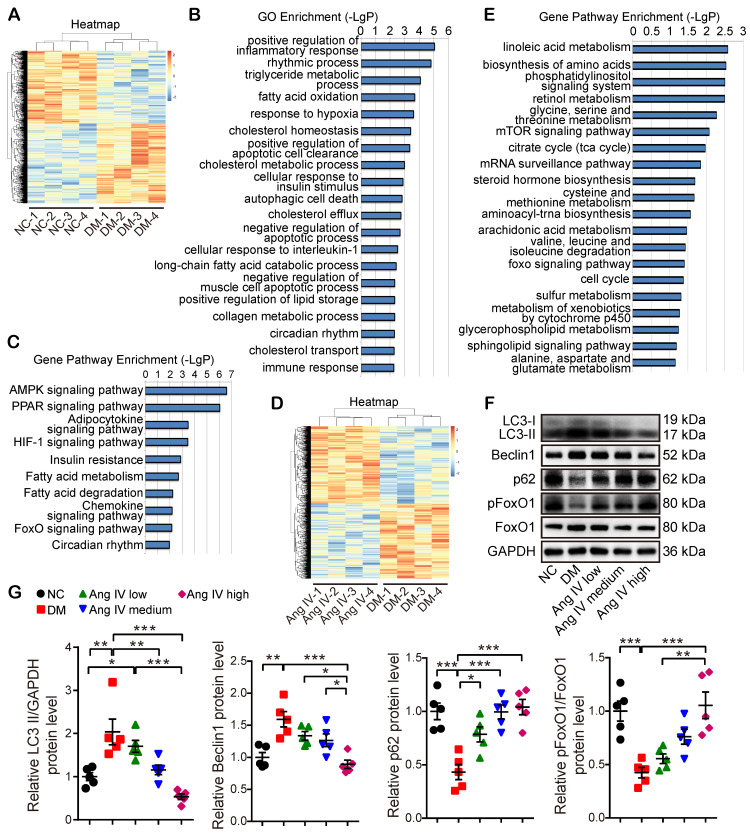
Transcriptome profiles of the myocardium in 3 groups of mice and effects of Ang IV on the expressions of autophagy-associated proteins in the myocardium of 5 groups of mice. (A) Hierarchical clustering heatmap to identify differentially expressed genes in NC and DM groups of mice. (B) The top 20 biological processes from the GO enrichment analysis of differentially expressed genes in NC and DM groups of mice. (C) The top 10 gene pathways from KEGG pathway enrichment analysis of differentially expressed genes in NC and DM groups of mice. (D) Hierarchical clustering heatmap to identify differentially expressed genes in DM and DM+high-dose Ang IV groups of mice. (E) The top 20 gene pathways from KEGG pathway enrichment analysis of differentially expressed genes in DM and DM+high-dose Ang IV groups of mice. n=4 per group. (F) Representative Western blot images of LC3, Beclin1, p62, pFoxO1 and FoxO1 protein expression in the myocardium of the 5 groups of mice. (G) Quantification of LC3-II, Beclin1, p62 and pFoxO1/FoxO1 protein expression in the myocardium of the 5 groups of mice. n=5 per group. Ang IV: angiotensin IV; DM: diabetes mellitus; NC: normal control. *p < 0.05, **p < 0.01, ***p < 0.001.

