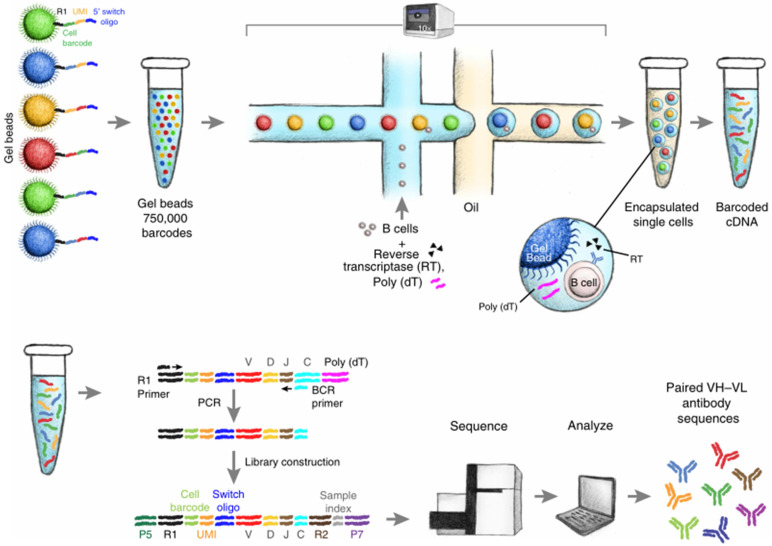
Figure 4.
Schematic diagram of single B cell sequencing. The magnetic beads with barcodes and UMIs are used to capture individual cells. Magnetic beads and individual cells are coated in oil. Then the cells are lysed and reverse transcription into cDNA. The barcode-encoded cDNA is then reversed transcription into a library and sequenced. The bioinformatic pipeline is used to analyze the heavy and light chain sequences from a single cell. Adapted with permission from Goldstein, copyright 2019 62.

