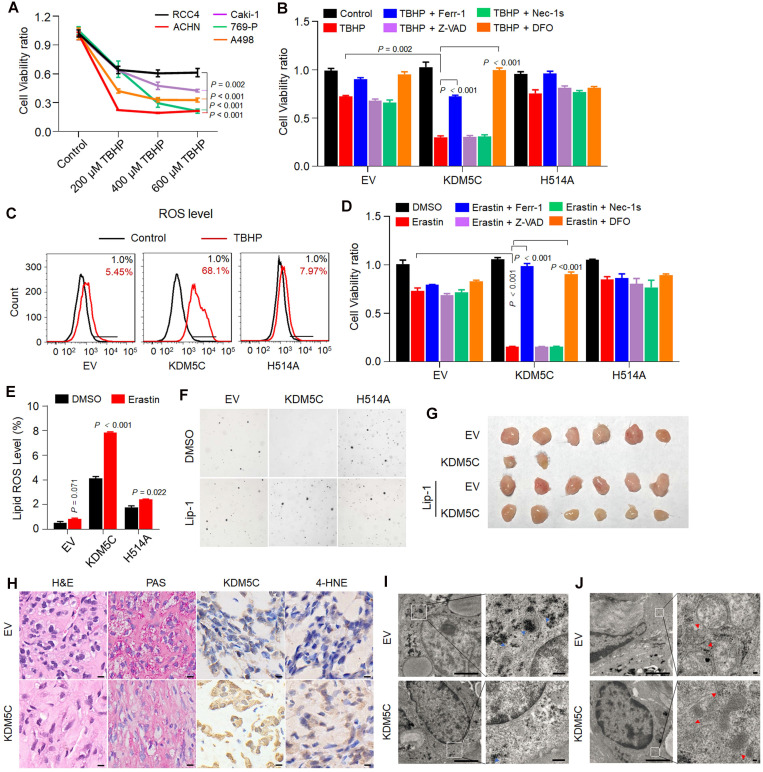
Figure 5.
KDM5C inhibiting tumorigenicity largely by inhibiting ferroptosis. A, Percentage viability of ccRCC cell lines (ACHN, Caki-1, RCC4, 769-P, A498) following exposure to tert-Butyl hydroperoxide (TBHP) at indicated concentrations for 3 h. P-value was calculated by Gehan-Breslow-Wilcoxon test. B, Bar graph showing cell viability in indicated cells treated with 200 µM TBHP combined with 5 µM Z-VAD-FMK (Z-VAD), 2 µM Necrostain-1s (Nec-1s), 2 µM Ferrostatin-1 (Ferr-1) or 50 µM deferoxamine (DFO). C, Indicated cells were loaded with 500 nM CellROX Green and the ROS were analyzed by flow cytometry. The experiment was repeated in triplicate. D, Bar graph showing cell viability in indicated cells treated with 2.5 µM Erastin combined with 5 µM Z-VAD, 2 µM Nec-1s, 2 µM Ferr-1 or 50 µM DFO for 48 h. E, After C11-BODIPY staining in indicated cells, lipid peroxidation was assessed by flow cytometry. The experiment was repeated in triplicate. F, Soft agar assay of RCC4-EV, RCC4-KDM5C, RCC4-KDM5C-H514A with or without liproxstatin-1(Lip-1). G, Image of NOD/SCID mice xenograft tumors derived from RCC4-EV and RCC4-KDM5C cells were treated with 10 mg/kg liproxstatin-1 (Lip-1) or saline, respectively (n = 6 per group). H, Hematoxylin and eosin (H&E), PAS, and immunohistochemical staining of tumor xenografts derived from RCC4-EV and RCC4-KDM5C cells. Scale bars, 20 µm. I and J, Representative images of transmission electron microscopy of indicated tumor xenografts. Blue arrows, glycogen (I); red arrows, mitochondria (J). Scale bars, 2 µm. P values were calculated using paired t-test (B, D, E). Data represent means ± SD.

