
Figure 5. ScRNA-seq analysis identifies landscape alterations of murine HNSCC upon anti-CD276 treatment.
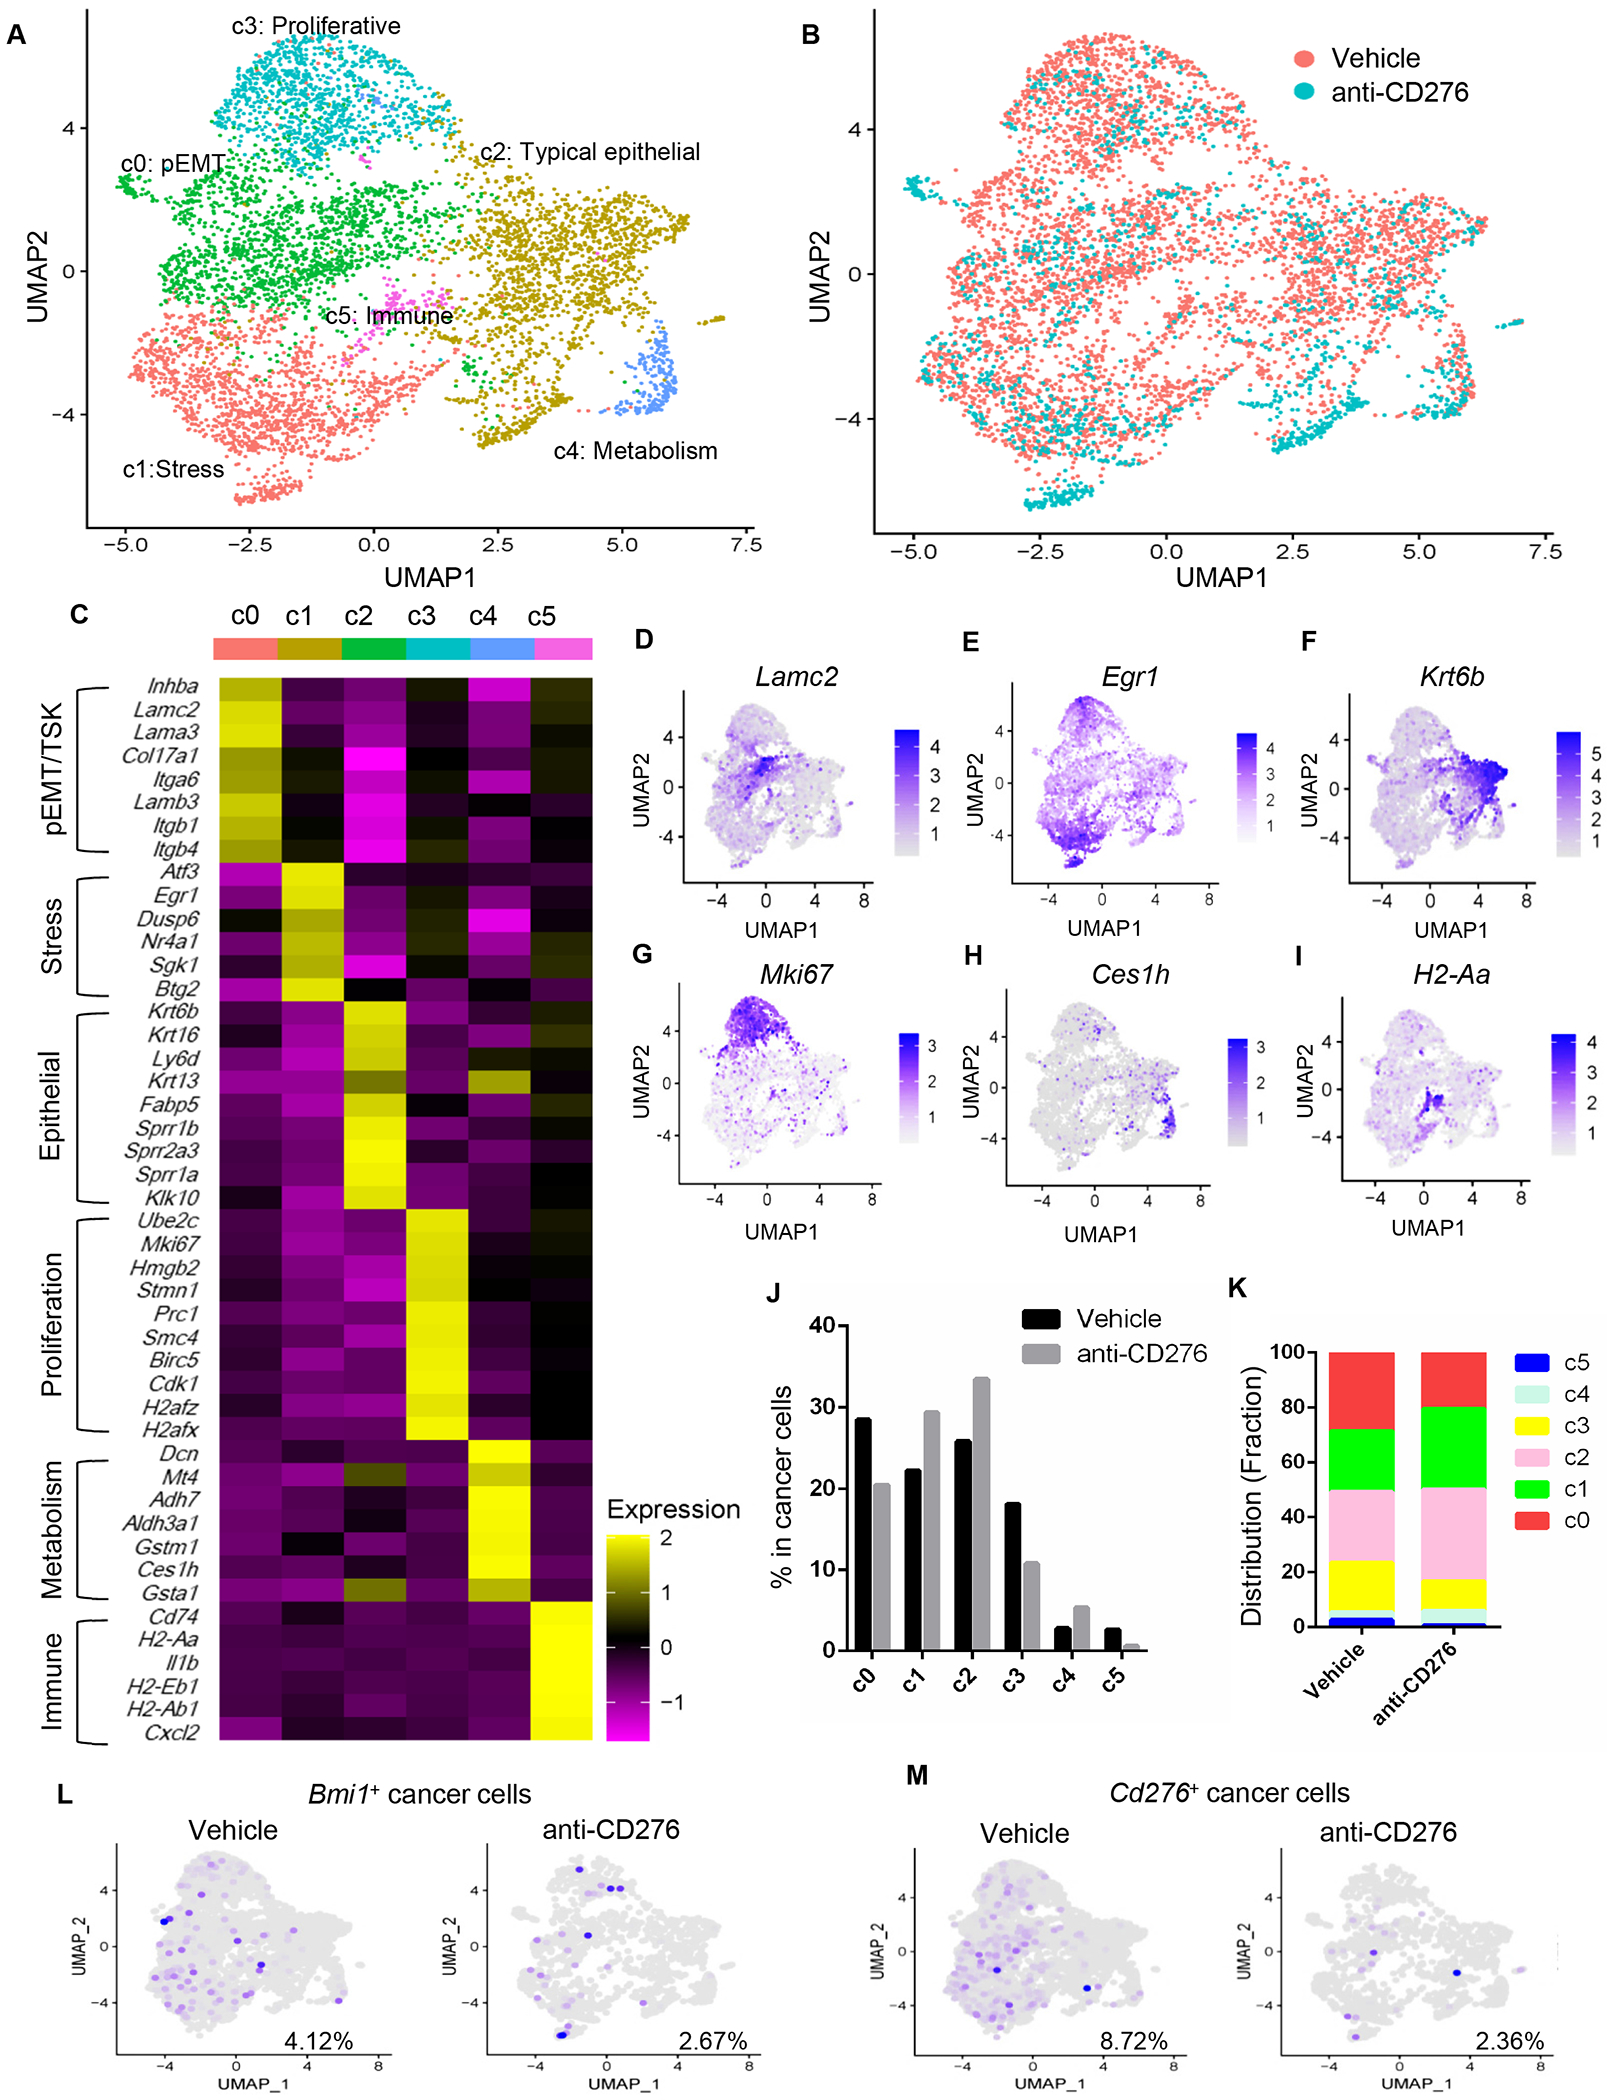
(A) UMAP plot showing identified cancer cell populations from two groups merged which were treated with control IgG and anti-CD276 for 4 weeks.
(B) UMAP plot showing distribution of annotated clusters within cancer cells upon control IgG or anti-CD276 treatment for 4 weeks.
(C) Heatmap displaying expression of selected marker genes in each cluster.
(D-I) UMAP plot of tumor cells displaying selected marker gene expression.
(J) Percentage of different cancer cell populations annotated in response of anti-CD276 treatment.
(K) Distribution fraction of different cancer cell populations annotated in response of anti-CD276 treatment.
(L) UMAP plot of Bmi1+ cancer cells upon anti-CD276 treatment.
(M) UMAP plot of Cd276+ cancer cells upon anti-CD276 treatment.
See also Figure S2