
Figure 6. CD276 blockade modulates tumor immune microenvironment of HNSCC.
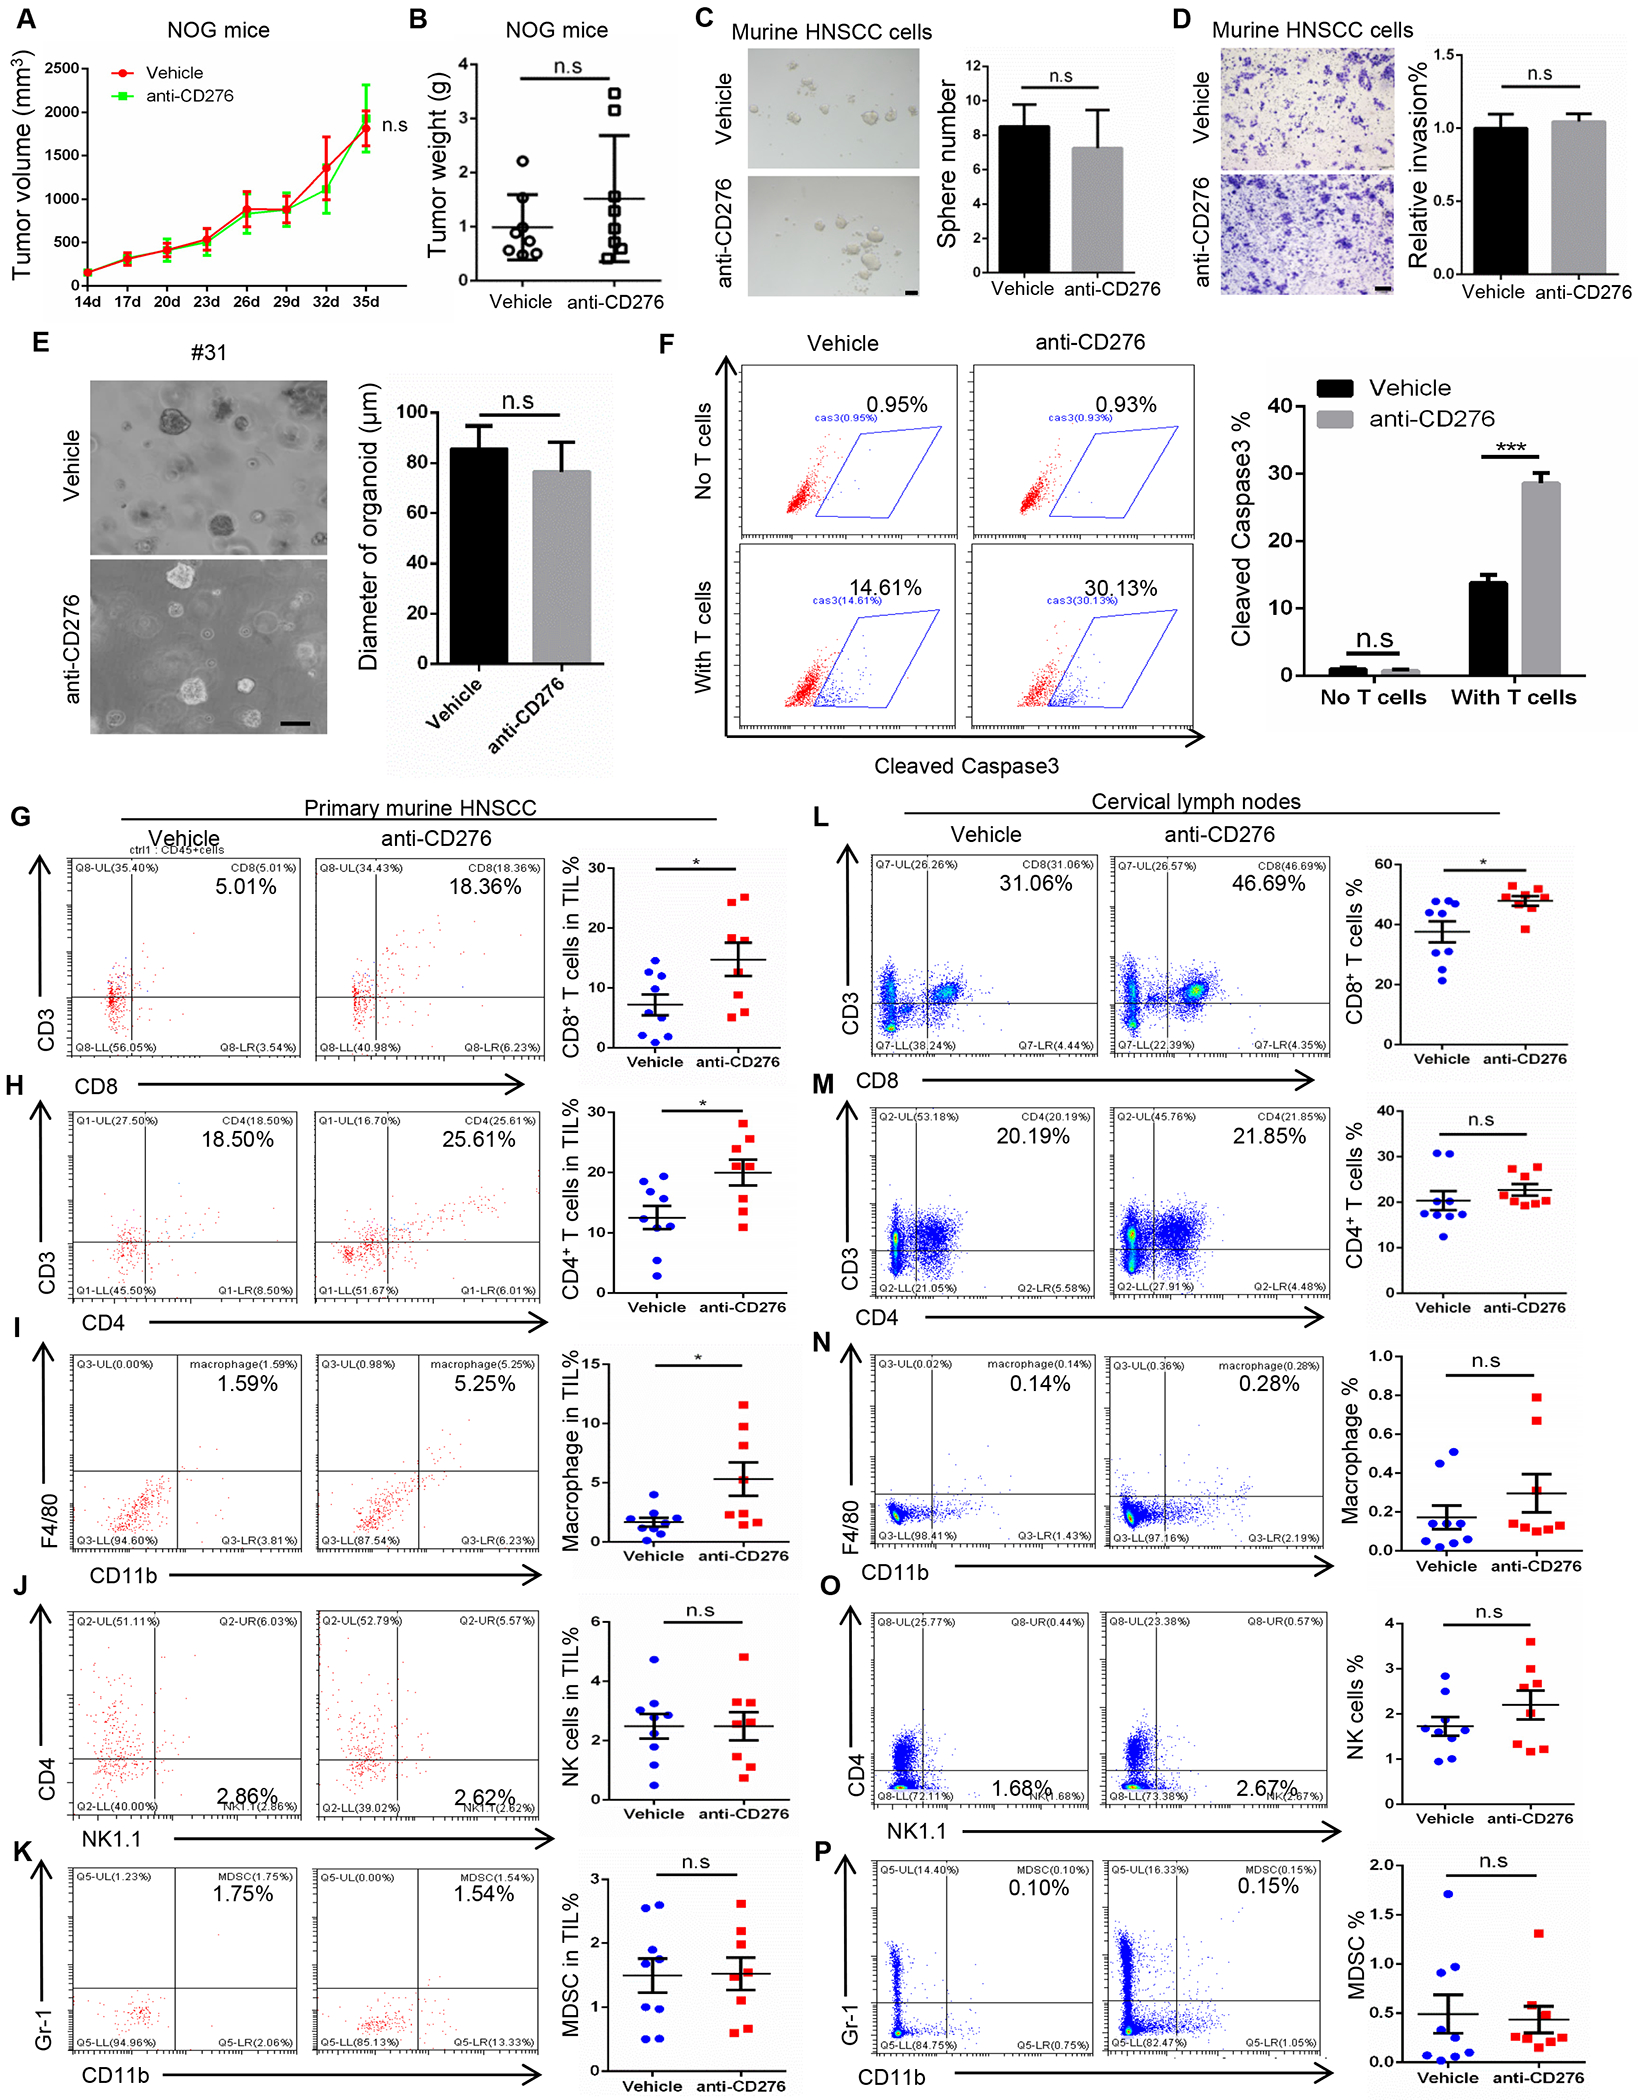
(A) Tumor volume in NOG mice bearing murine HNSCC treated with anti-CD276. Values are mean ± SEM., n = 8, two-way ANOVA, n.s., non-significant.
(B) Tumor weight in NOG mice bearing murine HNSCC treated with anti-CD276. Values are mean ± SD., n = 8, Student’s t-test, n.s., non-significant.
(C) Representative image and quantification of tumorspheres derived from murine HNSCC cells treated with control IgG and anti-CD276 antibodies. Student’s t-test, n.s., non-significant. Scale bar, 50μm
(D) Representative image and quantification of migrated murine HNSCC cells treated with control IgG and anti-CD276 antibodies. Student’s t-test, n.s., non-significant. Scale bar, 200μm
(E) Representative image and quantification of organoids derived from freshly isolated human HNSCC cells treated with control IgG and anti-CD276 antibodies. Student’s t-test, n.s., non-significant. Scale bar, 100μm
(F) The percentage of cleaved caspase 3 positive cells in HN6 cells treated with control IgG and anti-CD276 antibodies. HN6 cells were co-cultured with activated human peripheral blood T cells for 8h. ***p<0.001 by Student’s t test, n.s., non-significant.
(G-K) Frequencies of tumor-infiltrating CD8+ and CD4+ T lymphocytes, macrophages, NK cells and MDSCs in HNSCC upon anti-CD276 treatment for 10 days. Values are mean ± SD from the pool of three independent experiments. vehicle group, n=9; anti-CD276 group, n=8. *p<0.05 by Student’s t test, n.s., non-significant.
(L-P) Frequencies of CD8+ and CD4+ T lymphocytes, macrophages, NK cells and MDSCs in cervical lymph nodes upon anti-CD276 treatment for 10 days. Values are mean ± SD from the pool of three independent experiments. vehicle control, n=9; anti-276 group, n=8. *p<0.05 by Student’s t test, n.s., non-significant.
See also Figure S3