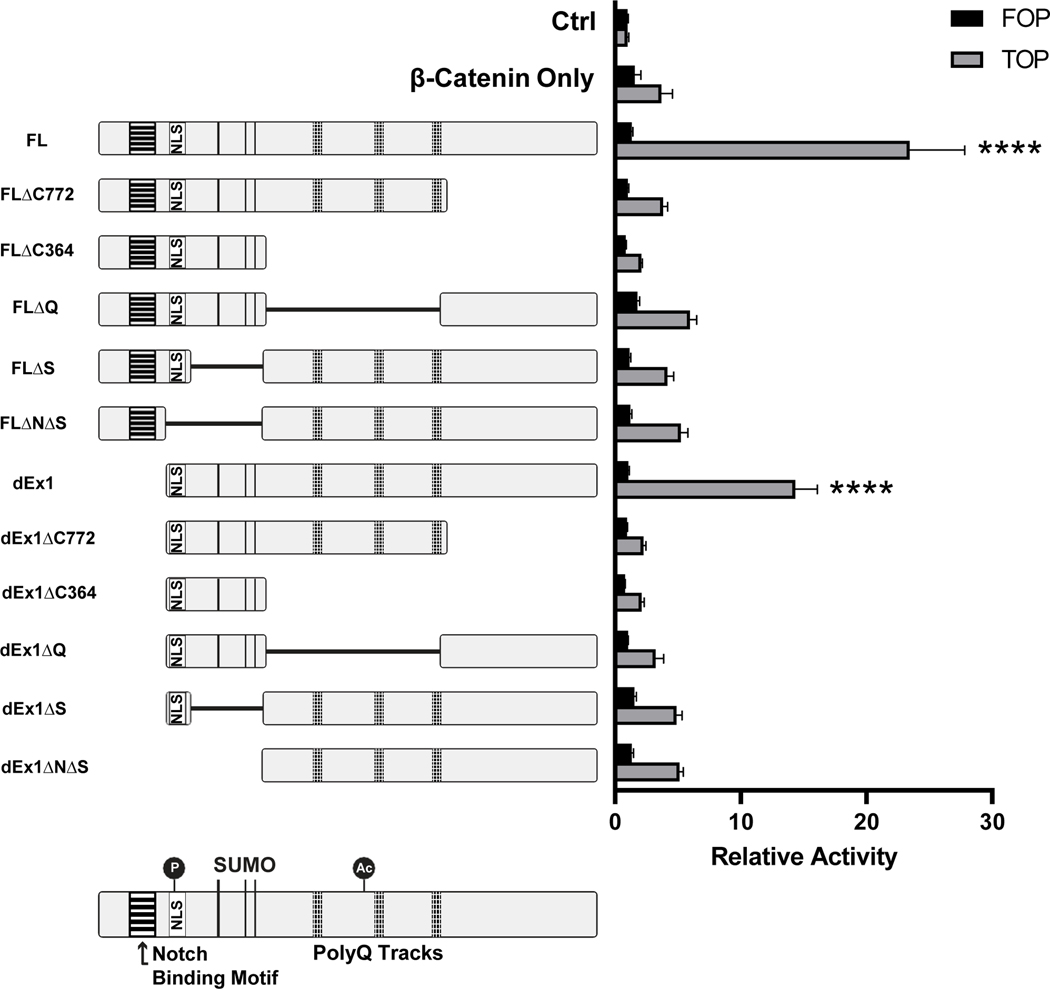
Figure 5. TCF/LEF promoter activation by MAML3 deletion constructs in SK-N-SH cells.
Diagrams of each MAML3 construct are shown to the left of their relative promoter activation by luciferase assay. All MAML3 constructs were co-transfected with β-catenin. Cells transfected with β-catenin alone, or with neither MAML3 nor β-catenin are shown as controls, in addition to the negative control FOP vector for every combination. (**** p<0.0001) Error bars represent SEM from at least three different experiments done in triplicate.

