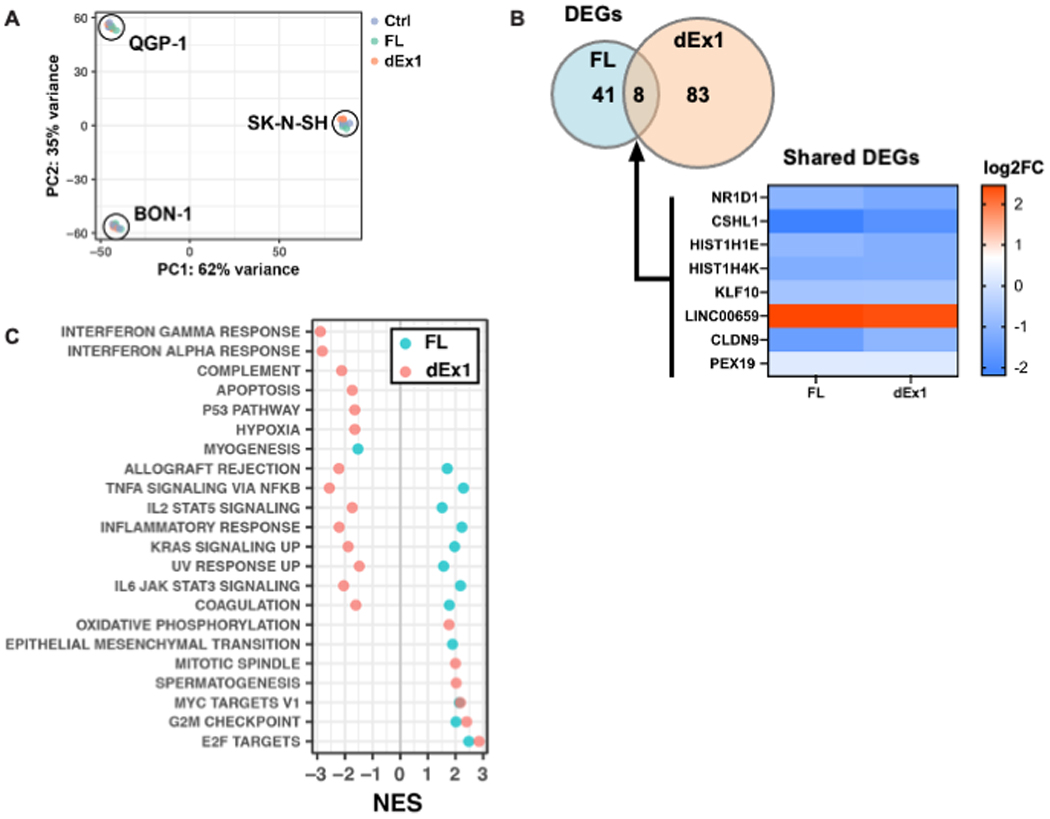
Figure 6. Transcriptomics reveal NOTCH independent roles for MAML3 shared across three cell lines.

A, mRNA sequencing of all three cell lines transfected with either control, FL MAML3 or dEx1 MAML3 was analyzed using principal component analysis (PCA) showing tight clustering according to cell line (N=3 for each cell line and each construct). We therefore used DESeq2 to account for cell line differences and isolate effects of the MAML3 overexpression for the rest of the analyses. B, Differentially expressed genes (DEGs) shared between cells with FL or dEx1 MAML3 are highly correlated (Pearson r = 0.98). C, GSEA of the MSigDB Hallmark collection shows enriched pathways related to proliferation, overlapping for both FL and dEx1 MAML3 overexpression (NES - Normalized Enrichment Score; all adjusted p-values < 0.05).
