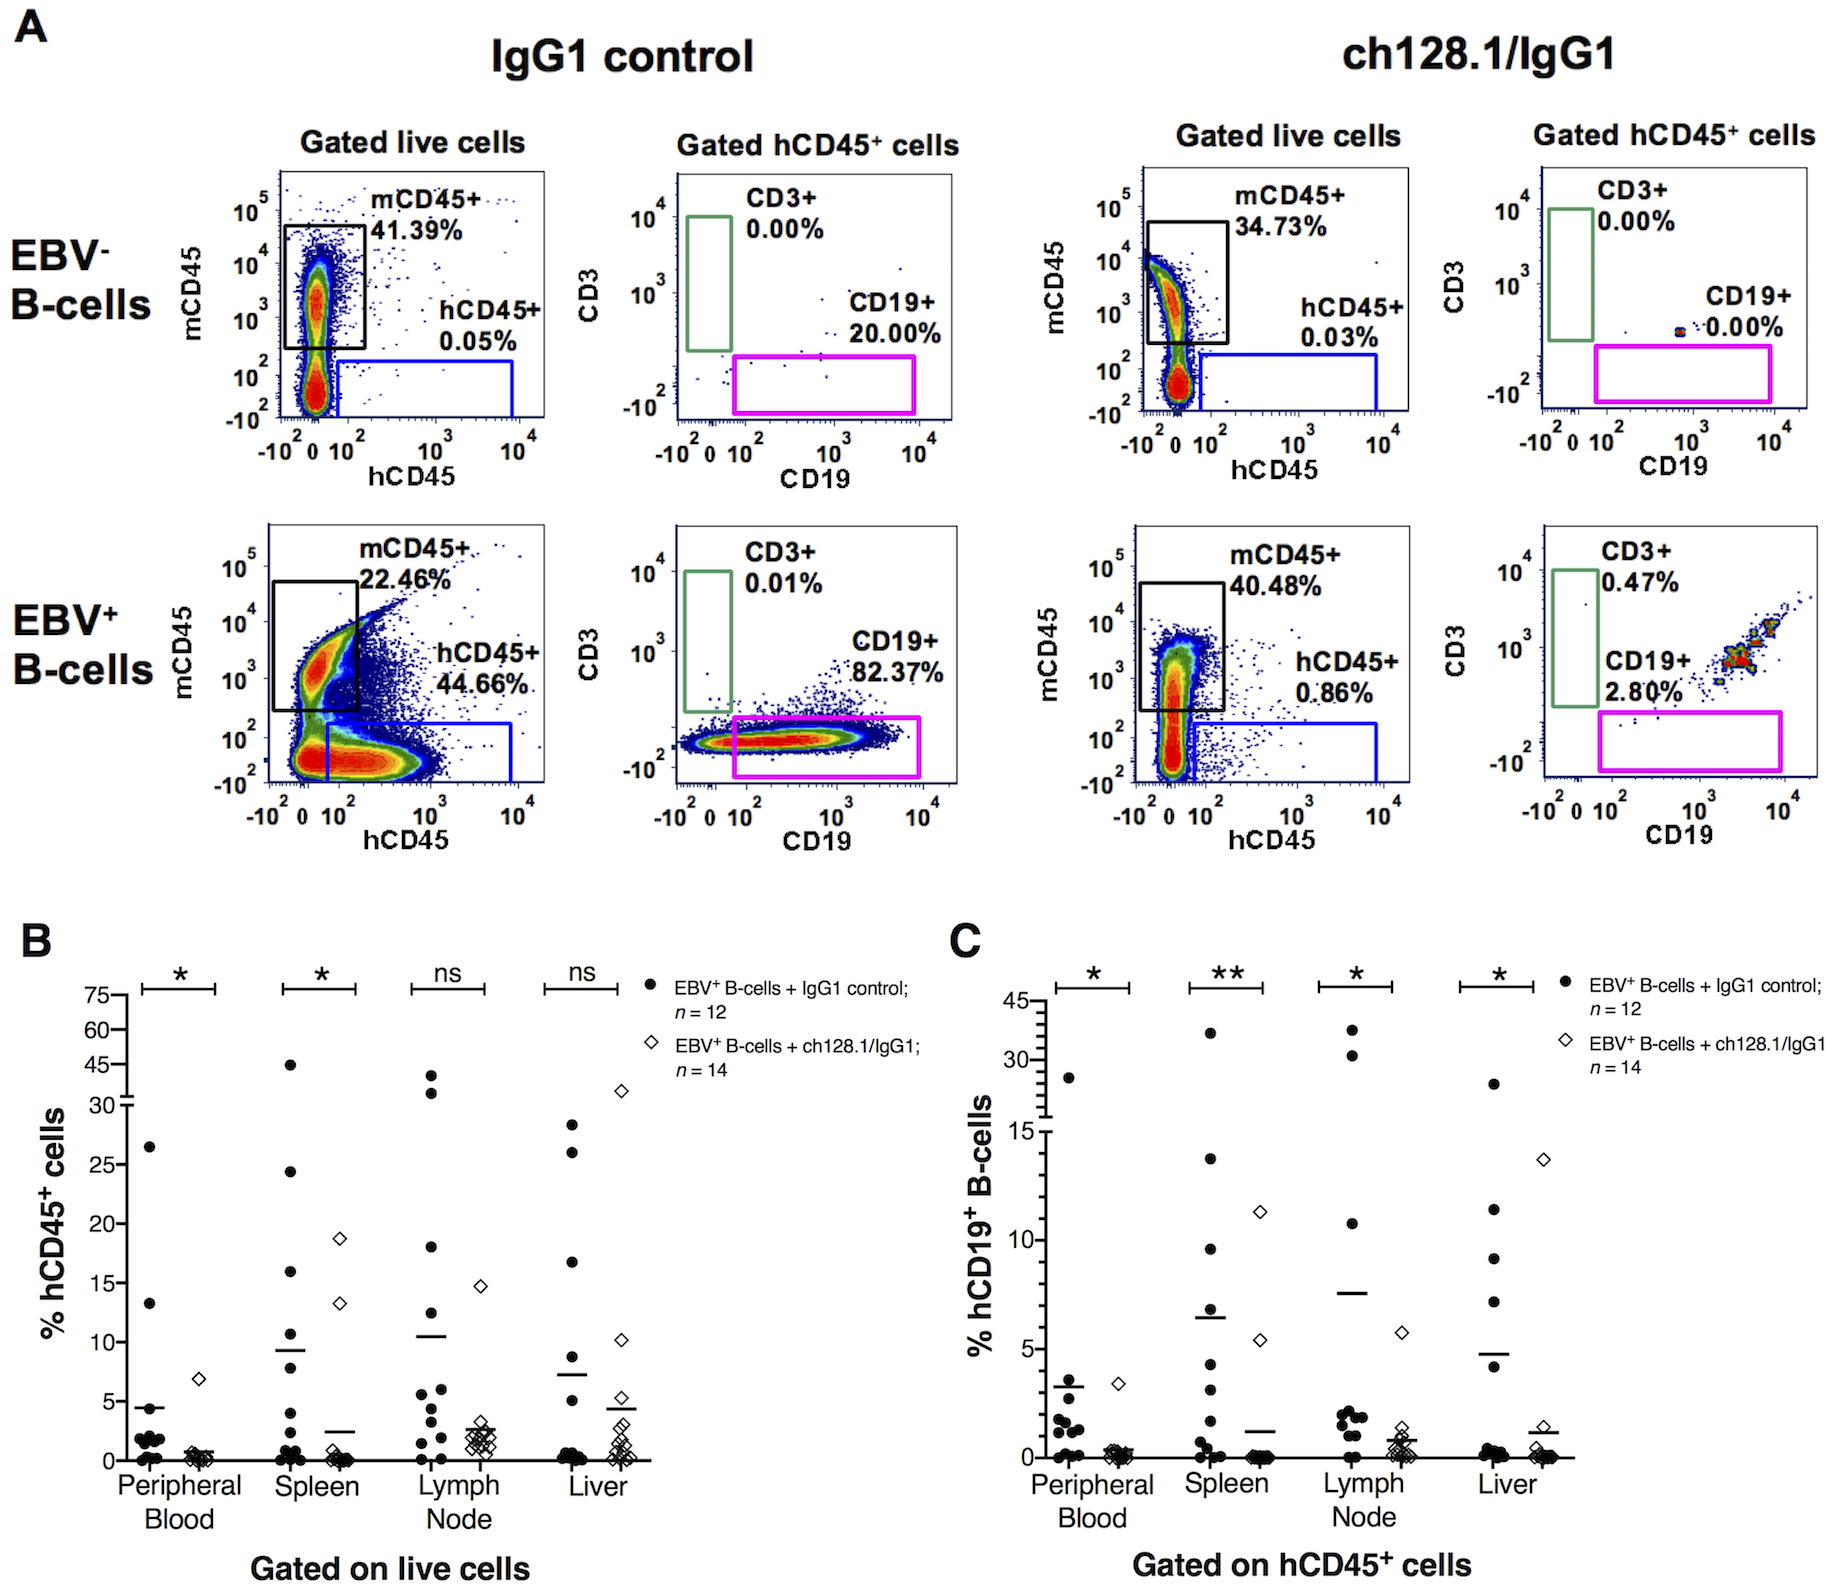
Figure 2. Mice implanted with EBV+ B-cell enriched preparations and treated with IgG1 control antibody had human CD45+ cells in blood circulation and in different tissues.

A, Representative flow cytometry plots of cells isolated from spleens of mice implanted with EBV− or EBV+ B-cell enriched preparations and treated with ch128.1/IgG1 or IgG1 control monoclonal antibody. Plots compare the percentage of murine CD45+ (mCD45+) and human CD45+ (hCD45+) cell populations (gated from live cells). Human CD3+ T-cell and CD19+ B-cell populations were gated from hCD45+ cells. B, Percentage of hCD45+ cells in peripheral blood, spleen, lymph node, and liver tissues for each EBV+ group treated with ch128.1/IgG1 or IgG1 control. The bars represent mean values of %hCD45+ B-cells; EBV+ group treated with ch128.1/IgG1: peripheral blood mean = 0.7%, spleen mean = 2.4%, lymph node mean = 2.6%, liver mean = 4.4%; EBV+ group treated with IgG1 isotype control: peripheral blood mean = 4.5%, spleen mean = 9.3%, lymph node mean = 10.5%, liver mean = 7.3%. C, Percentage of hCD19+ B-cells in peripheral blood, spleen, lymph node, and liver tissues. Percentages of hCD19+ B-cells were calculated from the total percentage of hCD45+ cells for each sample [(percentage of hCD19+) × (percentage of hCD45+ / 100%)]. The bars represent mean values of %hCD19+ B-cells; EBV+ group treated with ch128.1/IgG1: peripheral blood mean = 0.4%, spleen mean = 1.2%, lymph node mean = 0.8%, liver mean = 1.2%; EBV+ group treated with IgG1 isotype control: peripheral blood mean = 3.3%, spleen mean = 6.4%, lymph node mean = 7.6%, liver mean = 4.8%. Combined results shown in B and C are from 2 independent experiments. The results shown here for the EBV+ group treated with IgG1 control are from 12 of the 14 mice presented in Fig. 1B as two mice died before acquiring tissue at necropsy. Statistical comparisons were made for ch128.1/IgG1 versus IgG1 control treatments using nonparametric, unpaired Mann-Whitney tests, where *p = 0.01–0.05, **p = 0.001–0.01, and ns, not significant.
