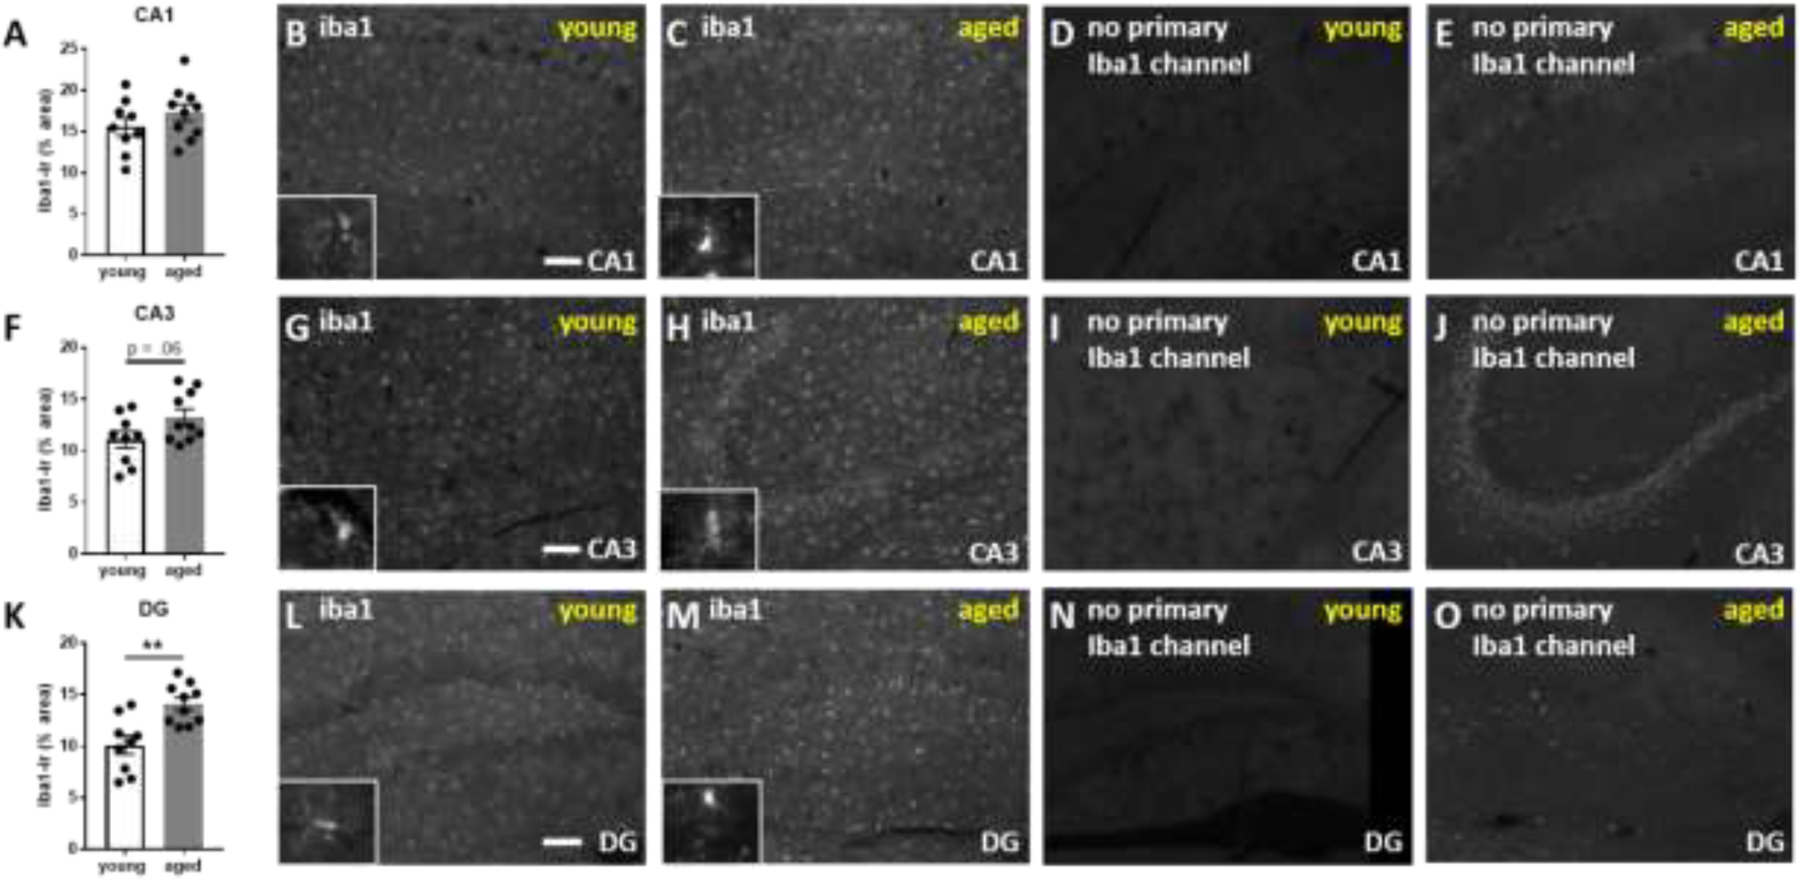
Figure 4.

Aged mice have increased iba1-immunoreactivity (-ir) in the hippocampus. A) Scatter bar graph depicts quantification of iba1-ir in CA1. Photomicrographs depict representative immunoreactivity in the iba1 channel for B) young versus C) aged mice in the CA1 region with representative no antibody controls for young D) versus E) old mice. F-J) shows the quantification and representative images for CA3 and K-O) shows the quantification and representative images for dentate gyrus (DG). Iba1-immunoreactivity is morphologically distinct from age-related autofluorescence and can be thresholded out above age-related autofluorescence. White scale bars equal 100 micrometers.
