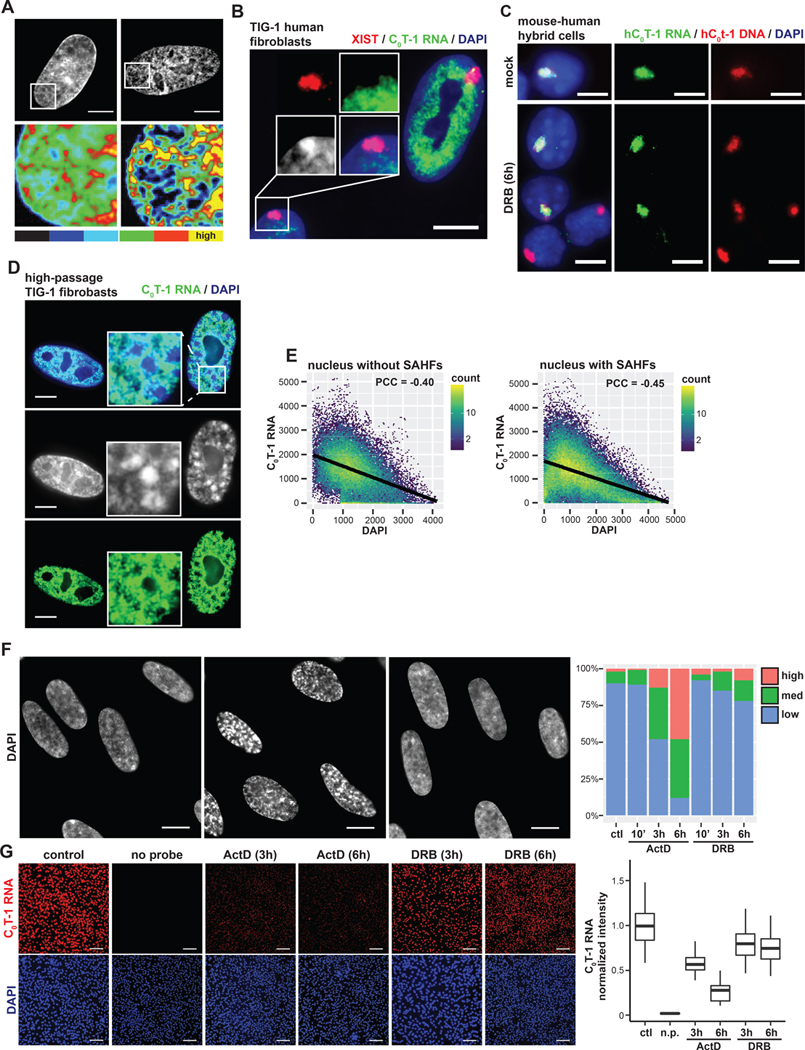
Figure 1. C0T-1 RNA is depleted from heterochromatin and inversely correlated with chromatin compaction.
(A) DNA staining and intensity heatmap (below) of permeabilized nuclei treated with RNase A for 10 minutes prior to fixation. Percentages indicate proportion of cells with obvious visible changes in DAPI signal as represented in the image (n=100). (B) RNA FISH on TIG-1 human fibroblasts demonstrating repeat-rich C0T-1 RNA is depleted from peripheral heterochromatin and the Barr body, which is coated by XIST. A line-scan intensity profile of the indicated region is displayed below. Scale bars 10 μm. (C) RNA/DNA FISH using human C0T-1 DNA as a probe on G11687 mouse human hybrid cells containing a single human chromosome 4. C0T-1 RNA and DNA signals overlap marking the human chromosome territory. Cells were either mock or DRB treated for 6 hours. Arrows point to G1 daughter cells that divided during transcription inhibition. (D) RNA FISH analysis of high passage (passage 35) fibroblasts. The cell on the right displays DAPI dense foci characteristic of SAHFs, indicated by arrows in the higher magnification inset. Low passage (passage 18) infrequently had SAHFs (4%, n=100) relative to high passage cells (32%, n=100). C0T-1 RNA was visibly depleted as shown from 96% of individual SAHFs scored (n=100). Scale bars 5 μm. (E) Pixel intensity scatter plots for nuclei shown on left. Linear regression model is indicated by black lines. Pearson correlation coefficients (PCC) between signal intensities were calculated for multiple nuclei and represent the mean with 95% confidence intervals +/− 0.03 (left, n=4) and +/− 0.09 (right, n=4). (F) DAPI staining of control and treated TIG-1 nuclei. Scale bars 10 μm. Examples of cells with medium (*) and high (**) levels of chromatin compaction changes as scored on the right for indicated treatments and times (n=100). (G) RNA FISH of C0T-1 RNA in control and cells treated with transcriptional inhibitors for 3 or 6 hours. A “no probe” (n.p) negative control was also performed. Scale bars 200 μm. On right, C0T-1 RNA signals were quantified per cell, normalized to DAPI intensity and then to the mean intensity of control cells (n=300 for each condition).

